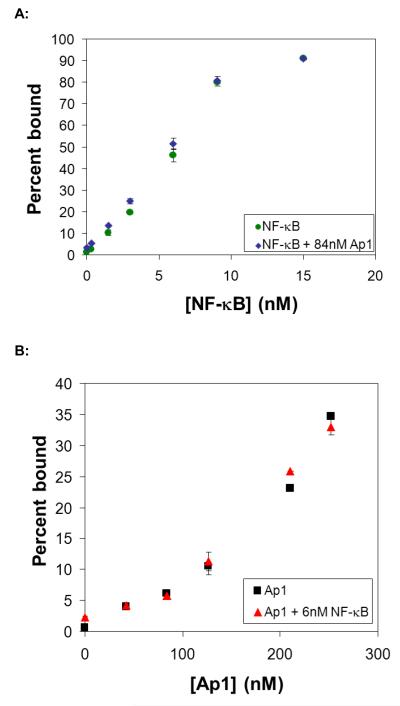
Figure 2. Detection of pure proteins alone and in the presence of a non-specific competitor.
(A) Detection of NF-κB:DNA complex with increasing amounts of NF-κB protein in the absence (green circles) or presence (blue diamonds) of Ap1. NF-κB protein was biotinylated, immobilized on the beads, and a mixture of DNA probes (radiolabeled NF-κB probe mixed with unlabeled Ap1, TFIID, and negative control probes) were mixed with TF-coated magnetic beads. The percentage of radiolabeled NF-κB probe remaining on the beads (relative to signal that did not bind or was washed from the beads) was plotted with respect to protein concentration. (B) Detection of Ap1:DNA complex with increasing amounts of Ap1 protein in the absence (black squares) or presence (red triangles) of NF-κB. Ap1 protein was biotinylated, immobilized on the beads, and a mixture of DNA probes (radiolabeled Ap1 probe mixed with unlabeled NF-κB, TFIID, and negative control probes) were mixed with TF-coated magnetic beads. The percentage of radiolabeled Ap1 probe remaining on the beads (relative to signal that did not bind or was washed from the beads) was plotted with respect to protein concentration. If not visible, error bars are within the plot symbol.

