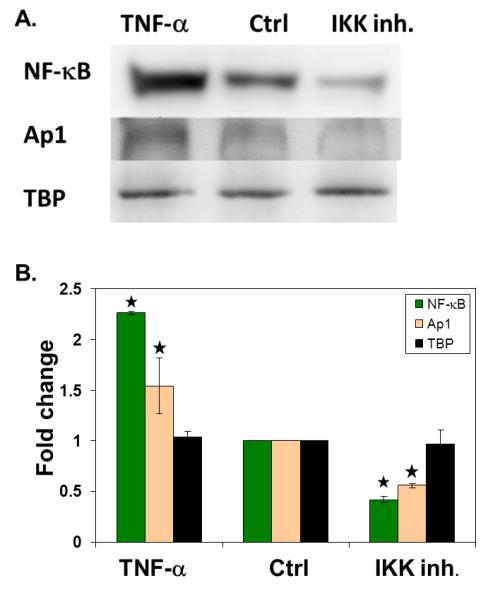
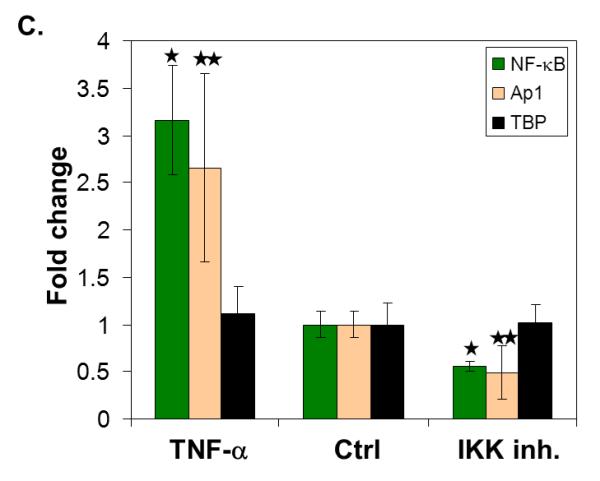
Figure 4. Quantification of TF levels in nuclear extracts after cell stimulation.
(A) Representative western blot showing detection of NF-κB, Ap1, and TBP in nuclear extracts after stimulation of the cultured cells with TNFα (TNFα), no treatment (ctrl), or inhibition of IKK (IKK inh.). The fold change in signal (ratio of sample to control) was plotted for each sample. (B) Quantification of the western blots for each protein. (n = 2) (C) TF levels measured by our technique. (n = 3) (* indicates p < 0.04 and ** indicates p < 0.15)


