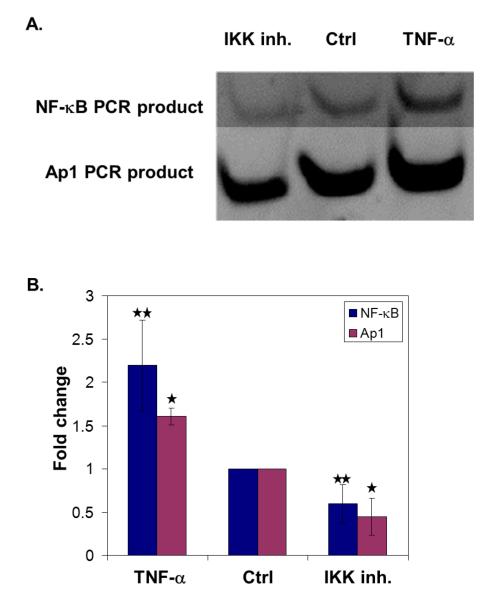
Figure 6. Parallel TF analysis in nuclear extracts after cell stimulation.
After treatment of cells with an IKK inhibitor (IKK inh.) or TNFα, nuclear extracts were analyzed for NF-κB and Ap1 levels. A. PCR analysis by electrophoresis, representative gel. Contrast was adjusted for NF-κB part of the gel for better visualization. B. Quantification of the corresponding gel images (n = 3). Band intensities were quantified with Quantity One software and ratio of sample to control was plotted. (* indicates p<0.07 and ** indicates p<0.13)

