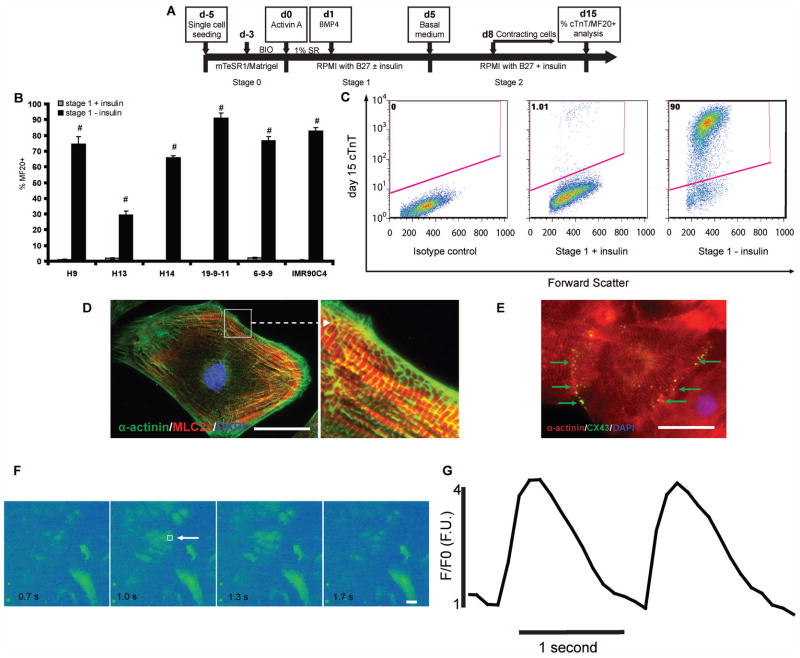
Figure 1.
(A) Schematic of protocol for hPSC differentiation to cardiomyocytes via Gsk3 inhibition, Activin A, and BMP4. The differentiation process is divided into three stages, d-5 to d0 (stage 0); d0 to d5 (stage 1); d5 and after (stage 2). (B–C) H9, H13, and H14 hESC lines and 19-9-11, 6-9-9, and IMR90C4 iPSC lines were cultured on Matrigel in mTeSR1 and then differentiated into cardiomyocytes according to (A). 15 days after initiation of differentiation, cells were analyzed by flow cytometry using the MF20 antibody. Error bars represent the s.e.m. of three independent experiments. # p<0.005, each pair of time points with insulin versus without insulin; t test. (C) 15 days after initiation of differentiation of 19-9-11 cells using the protocol shown in (A), cells differentiated in the presence and absence of insulin during stage 1 were analyzed for cTnT expression by flow cytometry. (D–G) Cardiomyocytes were generated from H9 cells using the protocol described in (A) without insulin during stage 1. At day 30, cells were individualized and replated on 0.1% gelatin coated coverslips. Immunostaining for (D) α-actinin (green) and MLC2a (red) shows sarcomere organization and (E) connexin 43 (green) and α-actinin (red) immunostaining shows gap junction formation between neighboring cardiomyocytes. Scale bar = 50 μm. (F–G) Cells were treated with 10 μM Fluo-4 AM for 15 min and then Ca2+ transients were recorded with a temporal resolution at 10 frames per second. Box (white arrowhead) in panel (F) denotes the site of analysis of absolute fluorescence normalized to initial fluorescence (F/F0) shown in panel G. Scale bar = 50 μm.

