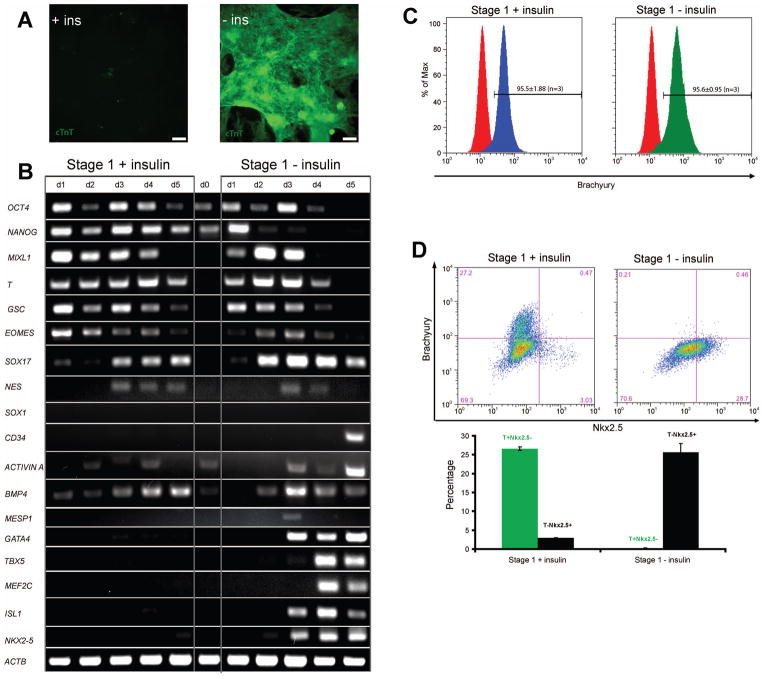
Figure 2.
(A) H9 cells were differentiated as described in Fig. 1(A). At day 15 hPSCs differentiated in the presence and absence of insulin during stage 1 (days 0–5) were analyzed for cTnT expression by immunofluorescence. Scale bar = 200 μm. (B) At different time points, mRNA was collected and RT-PCR analysis of pluripotent (OCT4, NANOG), mesendoderm (MIXL1, T, GSC, EOMES), ectodermal (NES, SOX1), endodermal (SOX17), hematopoietic progenitor (CD34), growth factors (ACTIVIN A, BMP4) and cardiac gene expression (MESP1, GATA4, TBX5, MEF2C, ISL1, NKX2-5) was performed. (C–D) After initiation of differentiation, cells were analyzed for (C) brachyury expression at day 1 and (D) brachyury and Nkx2.5 expression at day 5 by flow cytometry. Error bars represent the s.e.m. of three independent experiments.

