Figure 1.

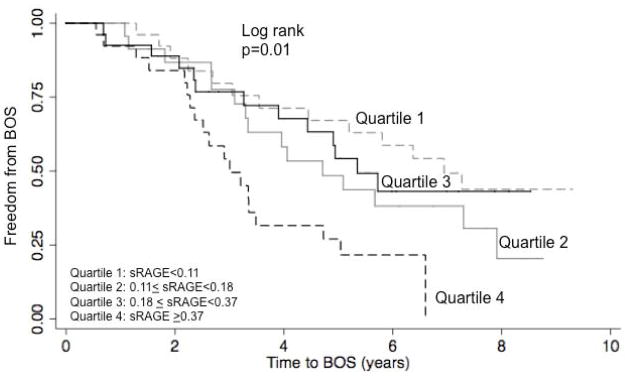
Kaplan Meier plot describing the association of quartiles of standardized sRAGE values with BOS. Quartile 1 is the lowest quartile of sRAGE and quartile 4 is the highest. p value generated from log rank test.

Kaplan Meier plot describing the association of quartiles of standardized sRAGE values with BOS. Quartile 1 is the lowest quartile of sRAGE and quartile 4 is the highest. p value generated from log rank test.