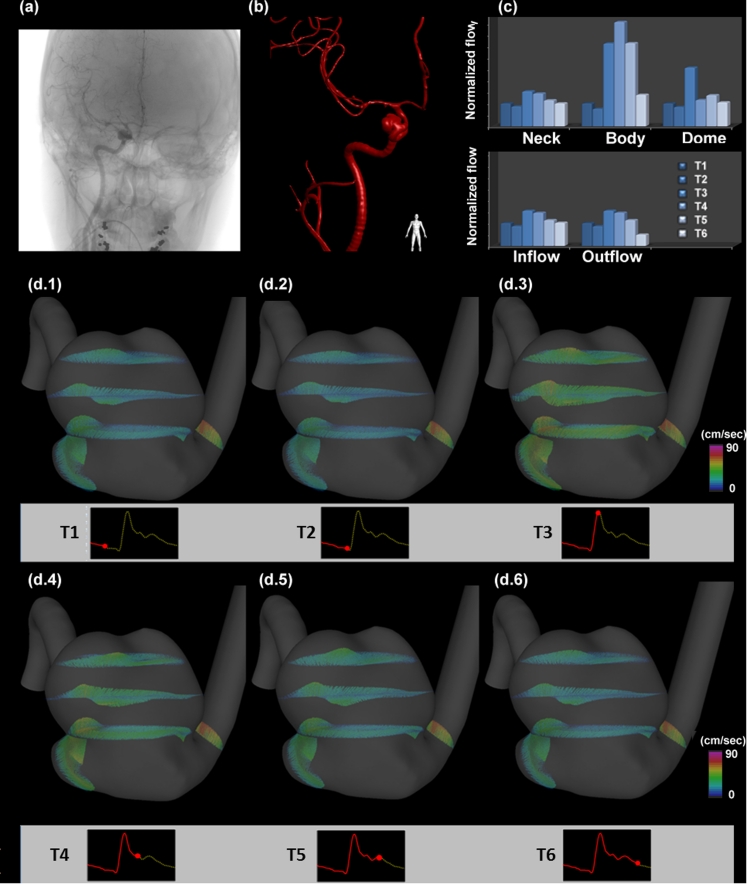
Fig. 2.
Flow changes in time at different regions of an aneurysm. a Original clinical angiogram to image the aneurysm. b 3D reconstruction of the blood vessels and the aneurysm. c Flow changes at different regions of the aneurysm (normalized flow using T1 flow rate as baseline) (d.1–d.6) the flow vector plots at regions of the aneurysm at corresponding times

