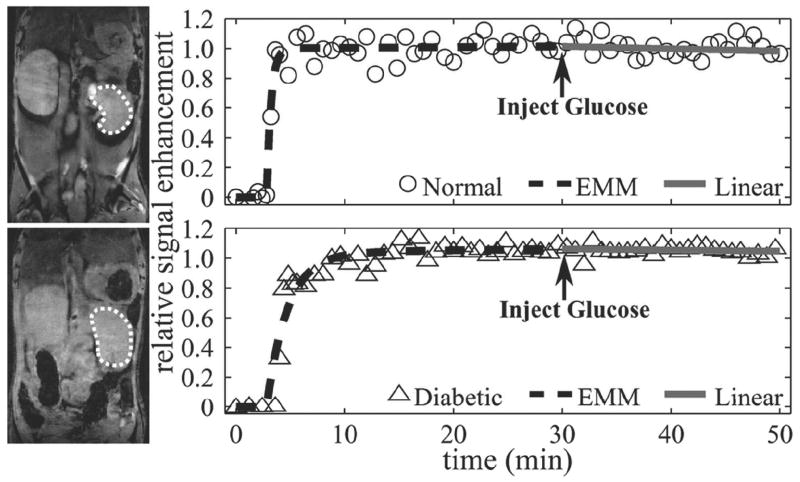
Figure 1.
Renal MR images and their corresponding uptake curves. The region of interest is outlined by a dashed line. Signal enhancement data (circle = normal, triangle = diabetic) for passive and active regions of Mn uptake were fit by an EMM (dashed line) and a linear function (solid line), respectively. Signal enhancement reached a plateau for both normal and diabetic kidneys by 30 min. Glucose-induced activation did not change the trajectory of the washout region (p > 0.05) in normal and diabetic animals.

