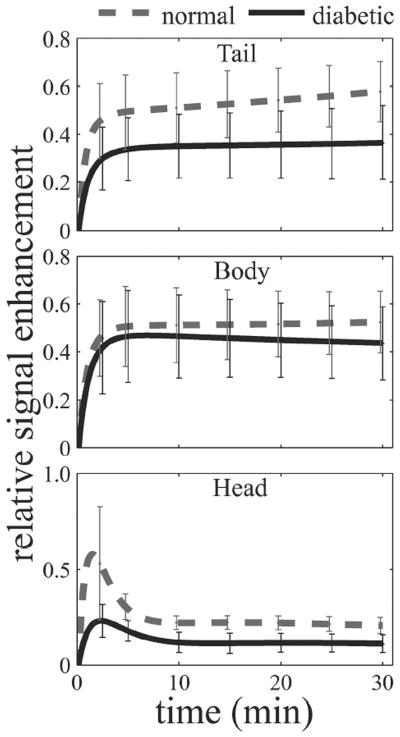
Figure 3.
Regional passive kinetic curves across the pancreas. Curves were generated using mean EMM parameters listed in Table 3. Error bars represent 2s. The rate of uptake in the normal tail was significantly greater than the diabetic. A comparison of the remaining kinetic parameters suggest a slower washout rate and a higher peak enhancement but without statistical significance (p > 0.05).

