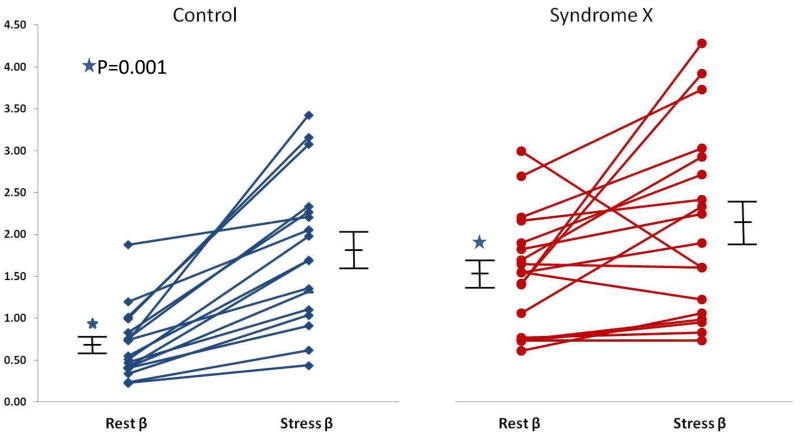
Figure 2.
β values at rest and during Dipyridamole stress in individual patients along with mean ±1 standard error of the mean in the control group (A) and the study group (B). Resting β is higher in the study compared to control groups (marked by asterisk) and change in β during stress is less in the study compared to control group (not achieving statistical significance). See text for details.

