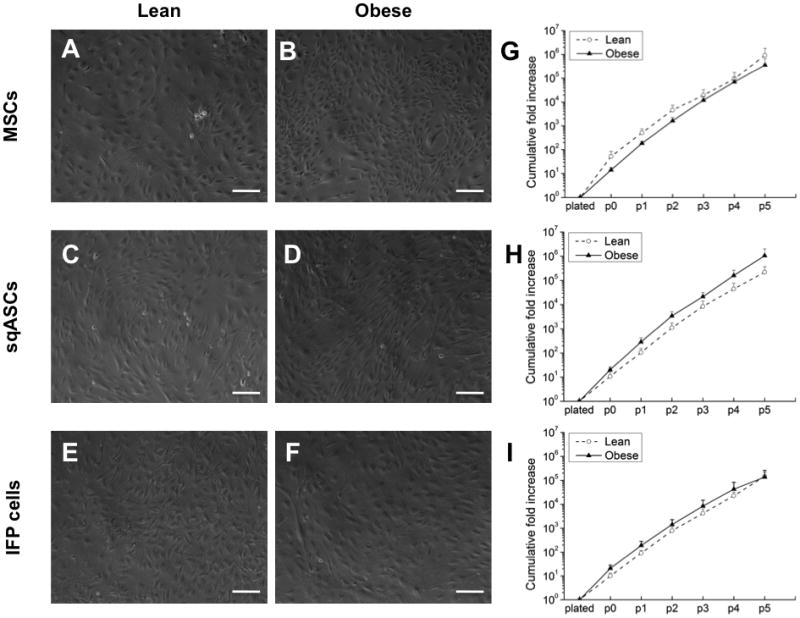
Figure 2.

Morphology of (A, C, E) lean and (B, D, F) obese stem cells at passage 3. The cumulative fold increase during expansion under hypoxic conditions through passage 5 of (G) MSCs (H) sqASCs and (I) IFP cells harvested from lean and obese mice. Obese sqASCs and IFP cells showed a trend toward increased proliferation, while obese MSCs had a trend toward decreased cell growth. Results averaged from 3 independent isolations with mean ± SEM displayed (n ≥ 3 mice per isolation). Scale bar is 100 μm.
