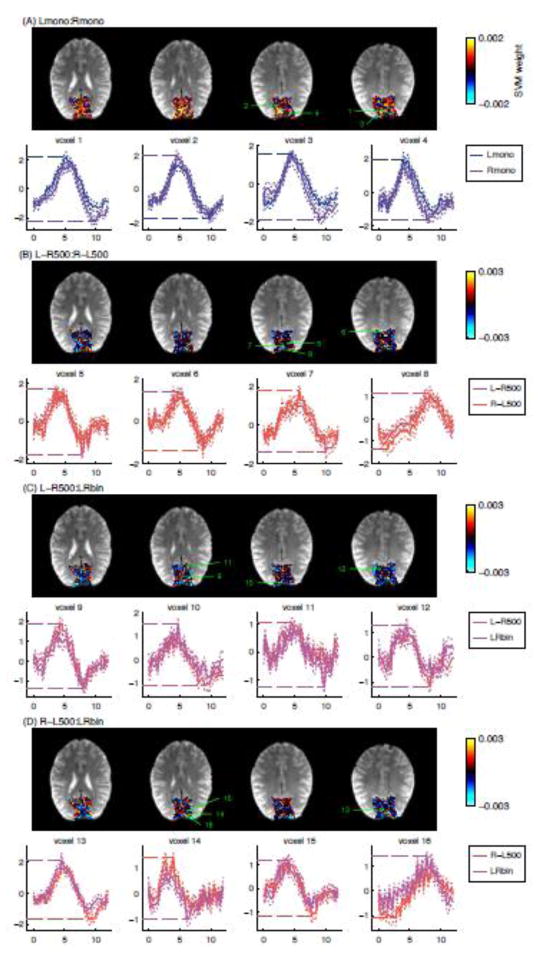
Figure 8.
Maps of the weight of support vector machine classification for Lmono:Rmono (A), L-R500:R-L500 (B), L-R500:LRbin (C), and R-L500:LRbin (D) for one representative subject (Subject 12 of Fig. S2 in the supplementary material). Event-related responses at voxels with largest absolute weight values were shown in the lower rows in each panel. The selected voxels were at least 8 mm apart from each other to display the variety of HDR shapes. The solid lines show the mean response estimates across runs and the thin dotted lines show the standard error of mean across runs. The digits on the map indicate the positions of the voxels selected to show their event-related responses. The horizontal dotted lines in the event-related response plot are the positive or negative peak value used for the decoding.

