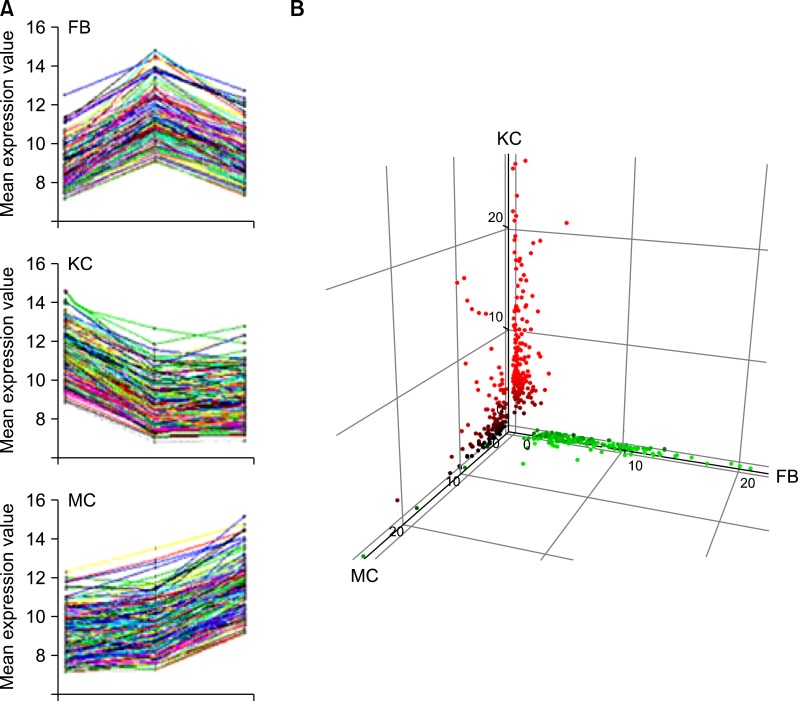
Fig. 2.
Self-organizing maps (SOM) analysis of the differentially expressed genes. (A) Four hundred and seventy eight genes were selected as differentially expressed genes, the expression levels of which showed changes greater than fourfold over the other two cell types. Each cluster is represented by its gene expression value. The numbers in each graph show the number of genes belonging to the corresponding cluster. (B) Three-dimensional deposition of differentially expressed genes. KC: keratinocytes, FB: fibroblasts, MC: melanocytes.

