Figure 5.
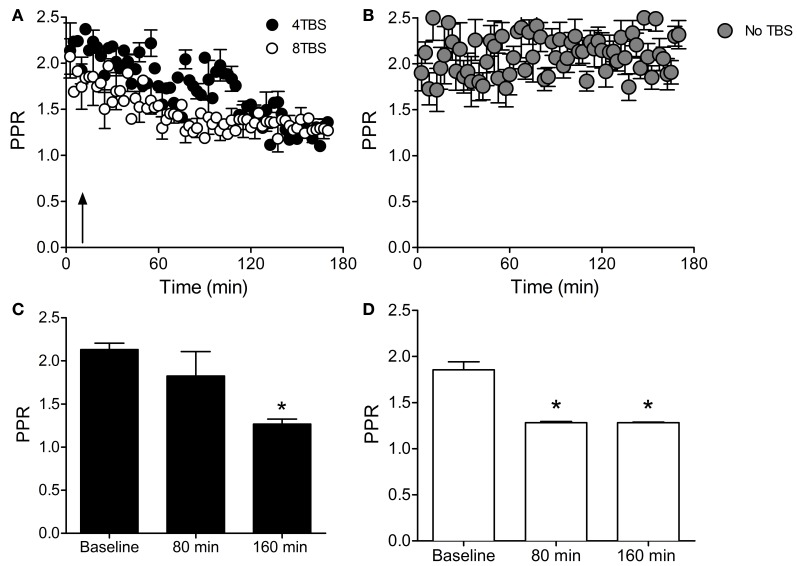
PPR measurements demonstrate increased release probability with LTP2 and LTP3. (A) Paired-pulse ratio (PPR) in slices stimulated with 4TBS and 8TBS (at time point indicated by arrow) showing a reduction in the ratio over time for both groups. (B) PPR was stable in the absence of TBS. (C) Bar graph showing mean PPR during the first 10 min of recording (Baseline) and at 80 min and 160 min post-4TBS. PPR was significantly reduced at 160 min post-4TBVS, consistent with the enhanced FM 1-43 destaining data for LTP2. (D) Bar graph as for (C) except for LTP3 data induced with 8TBS. PPR was significantly reduced at both 80 min and 160 min post-TBS, consistent with the FM 1-43 destaining data for LTP3. *Indicates 0.05

