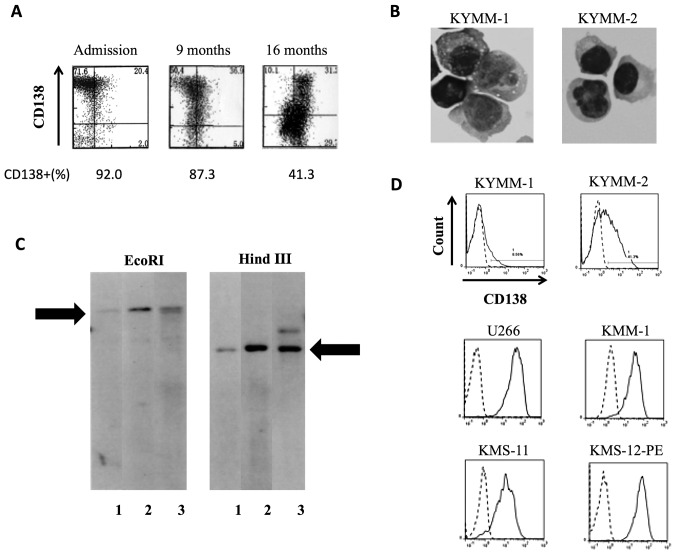
Figure 2.
Establishment of KYMM-1 and KYMM-2 MM cell lines. (A) Decreased CD138 expression was observed during the clinical course of the patient from who the KYMM-1 and KYMM-2 cell lines were established. (B) Morphology of KYMM-1 and KYMM-2. (C) Southern blot analysis of the immunoglobulin heavy-chain joining (Ig-JH) region. Lane 1, KYMM-1; lane 2, KYMM-2; lane 3, fresh samples from pleural effusion. DNA was digested by EcoRI and HindIII. Arrows indicate the same rearrangement bands. (D) CD138 expression in KYMM-1, KYMM-2 and other MM cell lines. Differences in CD138 expression were observed in KYMM-1 (8.6%) and KYMM-2 (41.3%) cell lines. Dashed lines, isotype matched control; solid lines, CD138.

