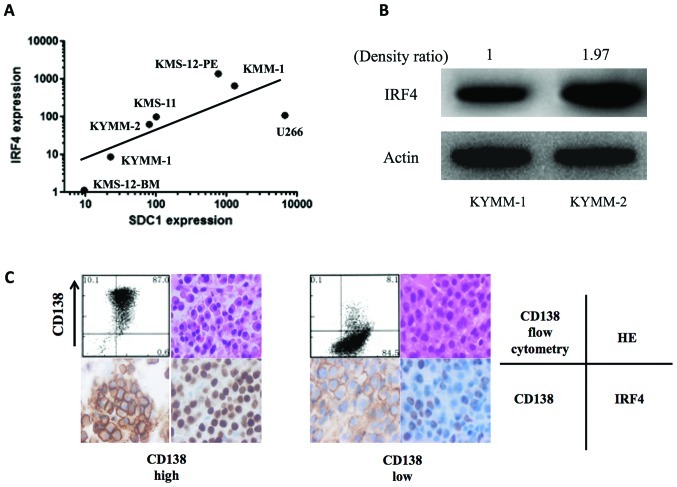
Figure 5.
Correlation of CD138 and IRF4 expression. (A) Gene expression of SDC1 and IRF4 were analyzed by real-time RT-PCR in seven MM cell lines. A positive correlation was observed between SDC1 and IRF4 gene expression (r=0.86, p=0.024, Spearman’s rank correlation coefficient). (B) Western blot analysis of IRF4 in KYMM-1 and KYMM-2 cells. The density ratio was calculated using ImageJ software. Lower IRF4 expression was observed in KYMM-1 compared with KYMM-2 cells. (C) Immunohistochemistry of CD138 and IRF4 in primary MM samples. CD138 and IRF4 were highly expressed in a patient with high CD138 expression by flow cytometry, while CD138 and IRF4 were weakly stained in a CD138 low patient.

