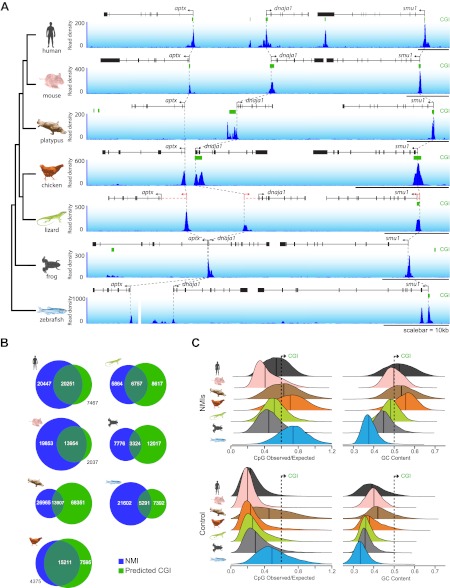
Figure 1. CpG island predictions do not accurately identify non-methylated islands of DNA in vertebrate genomes.
(A) Non-methylated DNA profiles in testes at a representative syntenic region for seven vertebrate species. Genes are shown in black (improved annotation of gene TSSs using RNA-seq data is shown in red), CpG island predictions in green (CGI), and non-methylated DNA profiles are shown in blue. A phylogenetic tree (left) highlights the evolutionary relationship among the seven species. Dashed grey lines highlight the relationship between the gene TSSs across the species. A gap in the zebrafish profile indicates that aptx is found at a separate locus from dnaja1 and smu1. (B) The genome-wide overlap between CpG islands (green) and non-methylated islands (blue) is depicted as a Venn diagram for each of the species. (C) Nucleotide properties of non-methylated islands and control regions are depicted as density plots. CpG observed/expected (left) and GC content (right) are shown for NMI and control regions of the genome. Median values are shown as dark vertical lines. Thresholds for CpG island prediction are indicated (black dashed line).


