. 2013 Feb 26;2:e00348. doi: 10.7554/eLife.00348

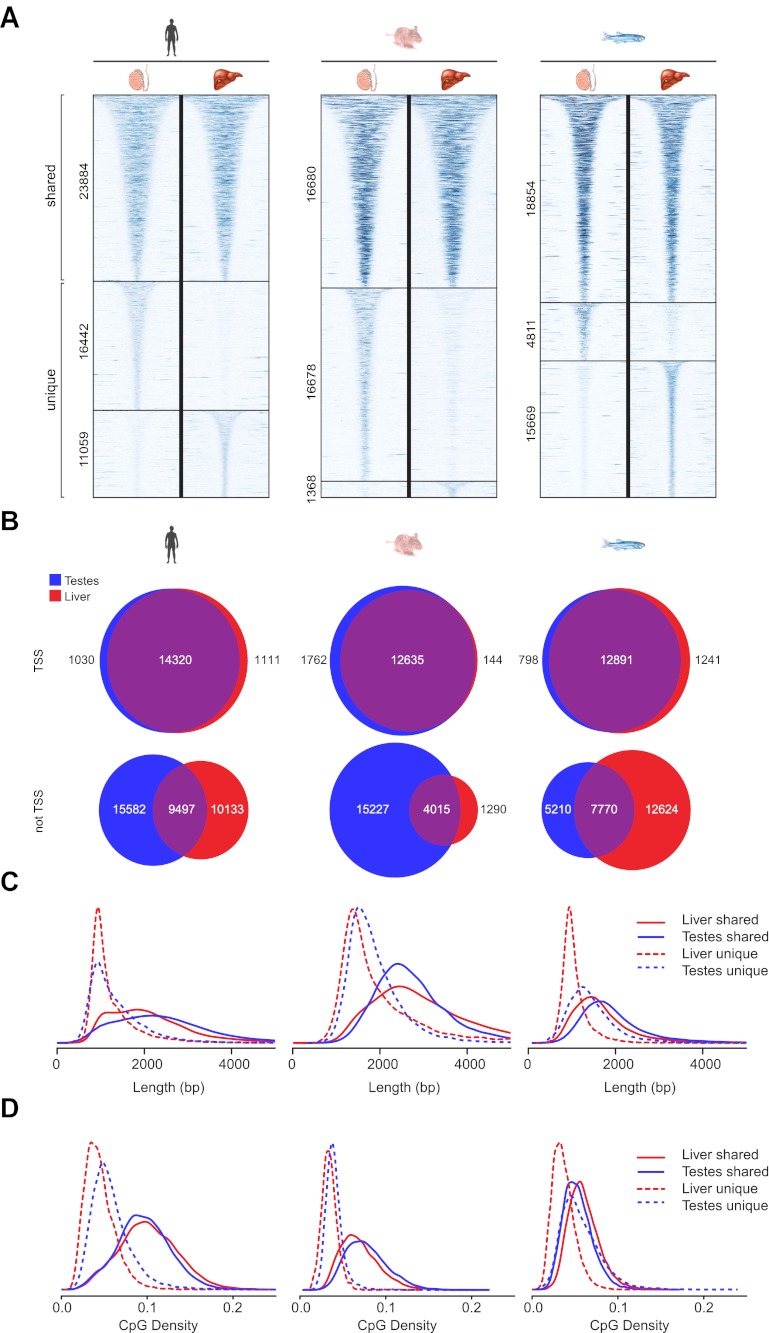
Figure 5. Differential methylation of a subset of NMIs.

(A) All vertebrate genomes have a subset of NMIs that are subject to differential methylation as illustrated by a heat map of non-methylated DNA signal from testes and liver in human, mouse and zebrafish. In each case NMIs are ranked according to length and clustered as shared (upper) or unique (lower) between the two tissues. A 5-kb window centred at the NMI is shown and read density is indicated by colour intensity. (B) The overlap of NMIs identified in liver and testes is depicted by Venn diagrams for NMIs associated with protein-coding TSSs (upper) and for NMIs away from TSSs (lower). NMIs at TSSs are generally non-methylated in both tissues whereas differentially methylated NMIs tend to be found away from TSSs. (C) NMI length distribution plots for shared (Shared NMIs, solid line) or unique (Unique NMIs, dashed line) NMIs from testes (blue) or liver (red). Shared NMIs tend to be longer than tissue-specific unique NMIs. (D) CpG density distribution plots for shared (solid line) or unique (dashed line) NMIs from testes (blue) or liver (red). Shared NMIs tend to have higher CpG density than unique NMIs.

DOI: http://dx.doi.org/10.7554/eLife.00348.008

Figure 5.

Figure 5—figure supplement 1. Validation of differentially methylated NMIs between liver and testes in mouse and zebrafish by bisulfite sequencing.

Figure 5—figure supplement 1.

(A, i–iv) Mouse NMIs unique to liver or testes were analysed by bisulfite sequencing to verify that the regions were indeed differentially methylated. Traces of non-methylated DNA are depicted for differentially methylated regions in mouse liver (red) and testes (blue) with NMIs depicted as bars under the traces. The y-axis depicts read density. Methylation status of the unique NMIs was confirmed using the indicated bisulfite PCR amplicon (BA, black rectangle). Empty and filled circles represent non-methylated and methylated CpG dinucleotides, respectively. (B, (i–iii) Zebrafish NMIs unique to liver or testes were validated by bisulfite sequencing as in (A).
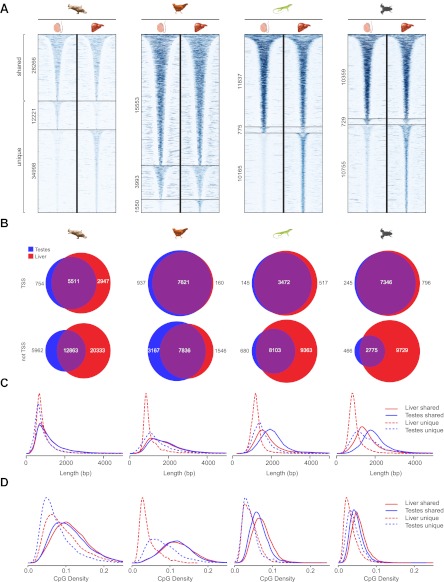
Figure 5—figure supplement 2. Differential methylation of NMIs in platypus, chicken, lizard and frog and length distributions of NMIs from all seven vertebrates.

Figure 5—figure supplement 2.

(A) A heat map of non-methylated DNA signal from testes and liver in platypus, chicken, lizard and frog. In each case NMIs are ranked according to length and clustered as shared (upper) or unique (lower) between the two tissues. A 5-kb window centred at the NMI is shown and read density is indicated by colour intensity. (B) Venn diagrams demonstrate that shared NMIs are found predominantly at protein-coding gene TSSs (upper) and unique NMIs tend to be found away from TSSs (lower). (C) NMI length distribution plots for shared (Shared NMIs, solid line) or unique (Unique NMIs, dashed line) NMIs from testes (blue) or liver (red). Shared NMIs tend to be longer than tissue-specific unique NMIs. (D) CpG density distribution plots for shared (solid line) or unique (dashed line) NMIs from testes (blue) or liver (red). Shared NMIs tend to have higher CpG density than unique NMIs.
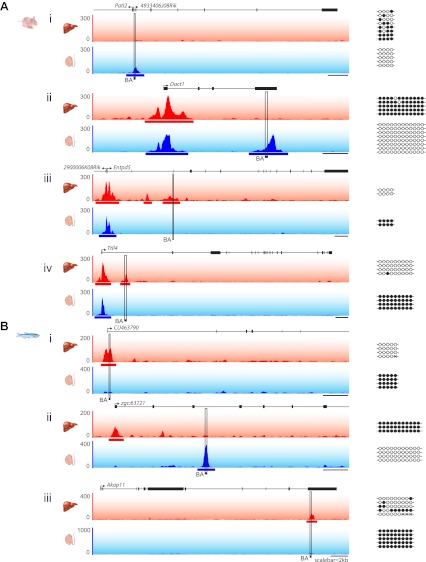
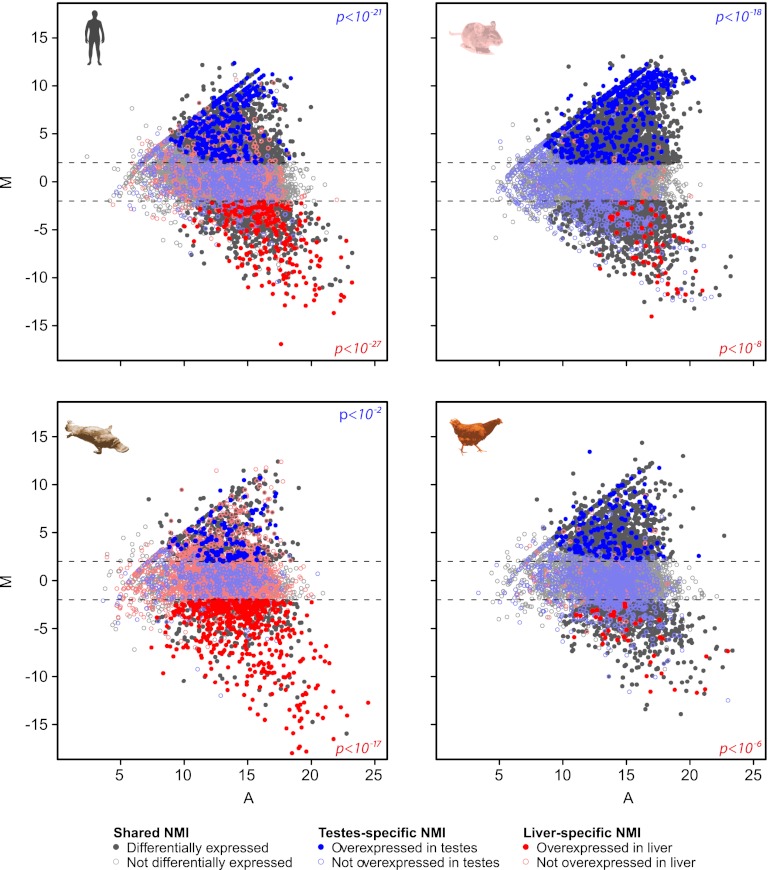
Figure 5—figure supplement 3. Genes with TSS-associated testes or liver specific NMIs are over-represented for increased differential expression in the same tissue.

Figure 5—figure supplement 3.

MA plots depicting expression differences for genes with TSS-associated NMIs from liver and testes for human, mouse, platypus and chicken. Genes are coloured according to whether they share an NMI in both liver and testes (grey) or have an NMI only in liver (red) or testes (blue). Genes are further distinguished as being differentially expressed or overexpressed in a tissue-specific manner (dark, filled circle) or not (light, open circles). The log mean expression of the gene from both liver and testes is displayed on the x axis (A) and the log ratio of gene expression is displayed on the y axis (M). The dotted lines indicate a fold change threshold of two. Genes with tissue-specific NMIs were significantly over-represented in the set of genes which had increased differential expression in seven out of eight cases (Fisher's exact test, human testes p<10−21, liver p<10−27; mouse testes p<10−18, liver p<10−8; platypus testes p<10−2, liver p<10−17; chicken liver p<10−6).