Figure 7. A unique class of broad non-methylated islands encompass polycomb-regulated developmental genes.
(A) An example of a broad region of non-methylated DNA associated with the sp9 gene for four representative species (human, mouse, frog and fish). Dashed grey lines highlight the location of the gene TSSs across the four species. (B) Non-methylated DNA profiles are depicted for genes associated with broad NMIs (dark blue) and canonical NMIs (light blue) in mouse embryonic stem (ES) cells and frog stage 11–12. The profile is scaled to show an averaged gene with one gene length depicted upstream and downstream. (C) H3K4me3 ChIP-seq signal from mouse and frog was plotted as in (B). H3K4me3 profiles reflect the underlying non-methylated DNA profiles. (D) Genes associated with broad NMIs were analysed by gene ontology (GO) analysis for mouse ES cell and frog stage 11–12. Broad NMIs are found to be significantly enriched for GO term categories associated with sequence-specific DNA binding, transcriptional regulation and development. MF: molecular function; BP: biological process. p<10−5 for all GO terms. (E) H3K27me3 ChIP-seq signal from mouse and frog was plotted for the same gene sets as in (B). The profile is scaled to show an averaged gene with three gene lengths depicted upstream and downstream. As for H3K4me3, H3K27me3 ChIP-seq profiles correspond to the underlying non-methylated DNA profile. (F) A representative example of two broadly non-methylated genes gsx1 and nkx2.2 for mouse and frog. In both species, the broad non-methylated regions (green) are associated with the polycomb repressive mark H3K27me3 (red). In addition, in mouse, polycomb repressive complex 2 (ezh2, yellow and suz12, orange) and polycomb repressive complex 1 (ring1b, purple) components are associated with the broad non-methylated regions. The y-axis depicts read density. Genes are depicted above the profiles in black.

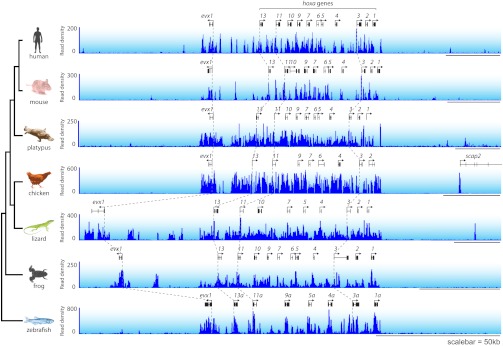
Figure 7—figure supplement 1. Hox gene clusters are characterized by broad NMIs.