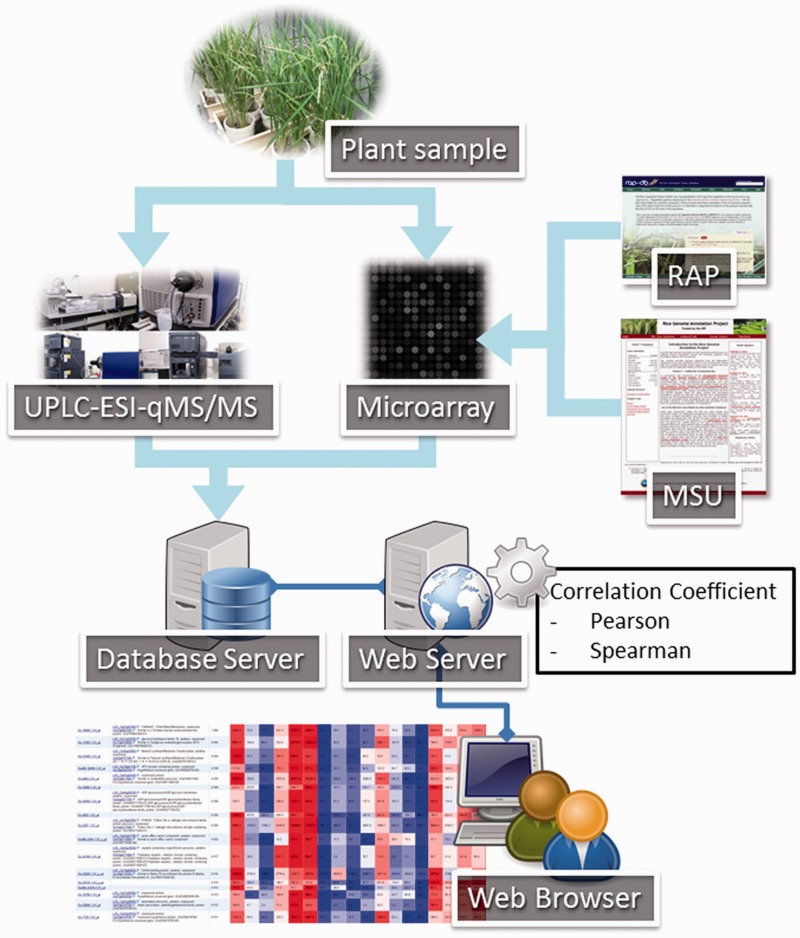
Fig. 2.
Schematic representation of the workflow to organize UniVIO. All plant samples were collected under the same conditions, and then were used to analyze the concentration of plant hormones and gene expression levels by mass spectrometry and microarray analysis, respectively. The gene annotation information was obtained from the Rice Annotation Project (RAP; http://rapdb.dna.affrc.go.jp/) and the Rice Genome Annotation Project (MSU; http://rice.plantbiology.msu.edu/), and was combined with the transcriptome data. Users retrieve data from the database server through the Web server using Web browsers. Correlation coefficients are computed on the Web server. Data tables are generated in the Web browser only. UPLC, ultra-performance liquid chromatography; ESI, electrospray ionization; qMS/MS, tandem quadrupole mass spectrometry.

