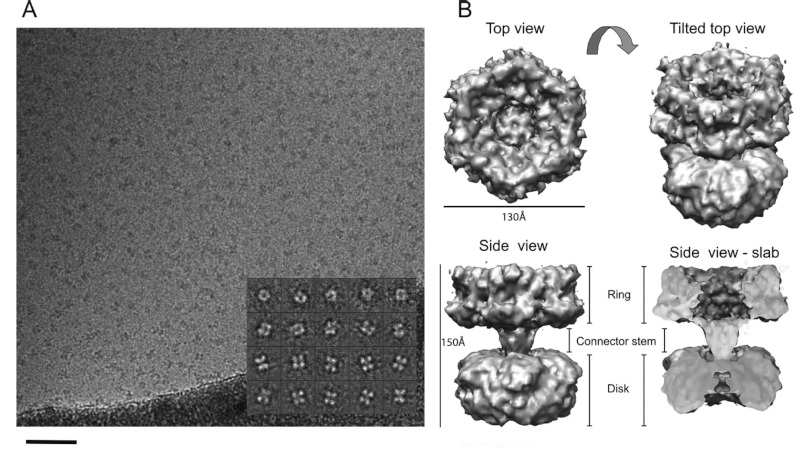
Figure 5. Determination of TtPilF structure by single particle averaging and cryoelectron microscopy.
(A) A sample field of ‘raw’ TtPilF particles embedded in thin vitreous ice. The inset shows examples of projection averages determined from the raw data (note that contrast is inverted for analysis so that protein appears white). The sample data shown are from the TtPilF–p[NH]ppA complex. Scale bar=1000 Å. (B) Surface-rendered three-dimensional volume of the six-fold symmetric TtPilF–p[NH]ppA complex (orthogonal views) displayed at a sigma value to accommodate 600 kDa of protein mass. The slab view has the foremost 50% of volume removed to display protein density through the complex. The figure was prepared using Chimera [37].

