Figure 12.
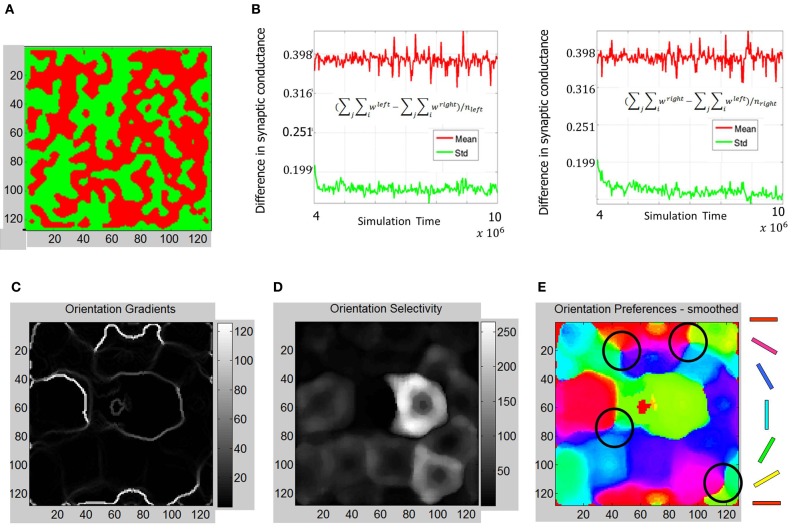
Functional maps summary and orientation selectivity of neurons in OSMs during Phase 3. (A) Comparison of functional map development during all three phases shows the progressive refinement of the ODM, RCM, and OSM. The ODM is stable and shows well-defined and contiguous patches of eye selectivity. (B) The mean and standard deviation parameters as described in Figures 7, 10 show more divergence and stability compared to Phase 2 The average fraction of the total synaptic drive for the “left” E neurons was ~123% and ~124% for the “right” E neurons at the end of Phase 3. (C) The resulting orientation gradient maps show well-defined fractures but no singularities. (D) The orientation selectivity has similar characteristic to that of Phase 2 except that the peak magnitude of selectivity showing more sharpness (i.e., higher magnitude). (E) The orientation preference maps show clearly defined iso-orientations and four weakly formed pinwheels marked by four black circles.

