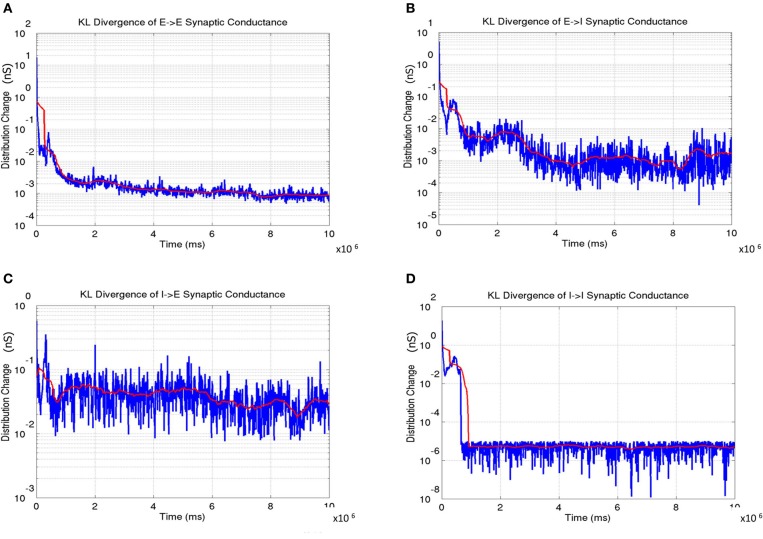
Figure 14.
The change in synaptic conductance distributions during the course of learning. (A) The E → E change shows a gradual decrease in the change with the lowest values in the third phase indicating stability in the formed OSM and ODMs. (B) The E → I change shows a similar trend as in (A). (C) The I → E change also shows gradual stabilization as a function of development. (D) The I → I change achieve stability very early and remain very stable after indicating that the synaptic conductances between inhibitory interneurons are stabilized rapidly compared to the other three types of synapses. In all the plots, the instantaneous change in synaptic conductance distributions at each time step is shown in blue while the average change is shown in red.

