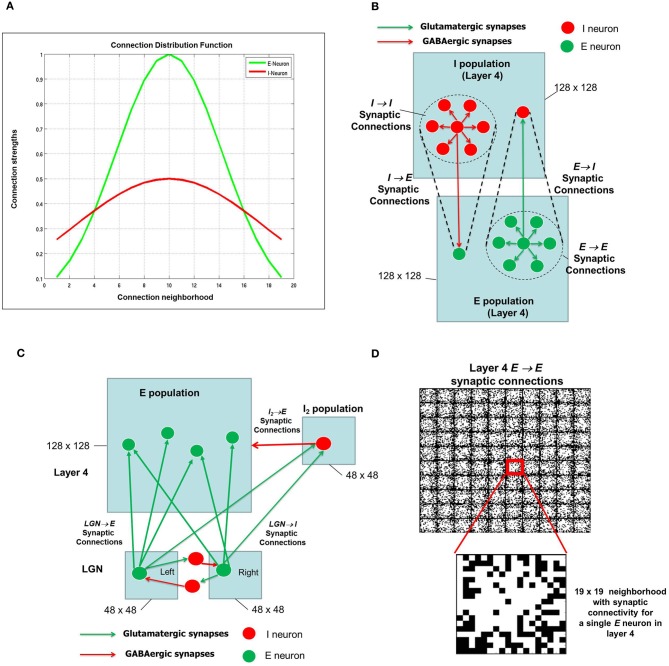
Figure 2.
The synaptic connectivity density distribution for the network. (A) From any E-neuron to any other neuron (E or I) in shown in green and from any I-neuron to any other neuron (E or I) is shown in red. (B) There are four types of synapses depending on the pre- and post-synaptic neuron: E → E, E → I, I → E, and I → I. It should be noted that the network has periodic boundary conditions such that topmost and bottommost neurons are regarded as neighbors, as are the leftmost and rightmost columns within each layer. The neighborhood around each E or I neuron is shown as a dotted circle. (C) The LGN network is also an E-I network as shown here with mutually inhibiting connections between neurons that receive inputs from the RGCs (not shown) from the left and right eye. Each LGN neuron from both eyes project to a neuron and its neighborhood in layer 4. For convenience, only one such projection is shown here. The LGN network (2 × 48 × 48) is smaller than the layer 4 network (128 × 128). In addition, the LGN inputs from the left and right eye populations project to the I2 population in layer 4 which consists of 48 × 48 inhibitory neurons as well. (D) The synaptic connections for a set of 10 × 10 E neurons in layer 4 are shown here. The red square shows a single E neuron with a 19 × 19 neighborhood. The white pixels within each such square indicate synaptic connections with maximum synaptic strength while black pixels indicate synaptic connections with zero synaptic strength. A closer look at the 19 × 19 neighborhood for one of E-neuron shows the initial strengths of synapses from the E-neuron in the center to its neighboring E neurons. These synaptic strengths are randomly distributed.

