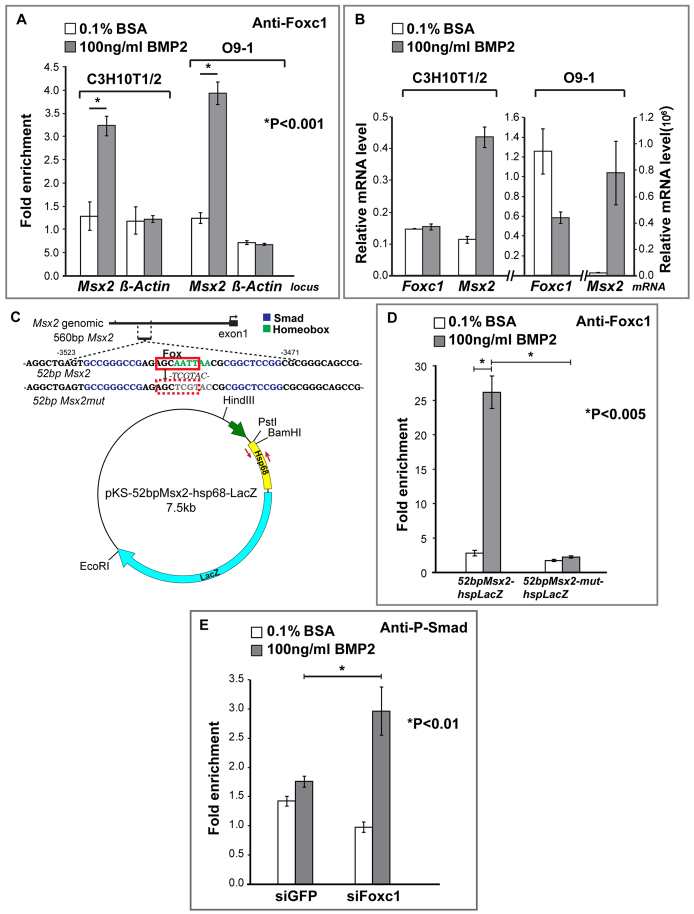
Fig. 6.
Foxc1 interacts with a Bmp-responsive element in the 560 bp Msx2 enhancer and inhibits the recruitment of P-Smad1/5/8. (A) Chromatin immunoprecipitation experiments in C3H10T1/2 and O9-1 cranial neural crest cells. We performed ChIP on control and BMP2-treated cells with an antibody against Foxc1 or rabbit IgG as a control. qPCR was used to amplify the 560 bp Msx2 enhancer as well as a control β-actin promoter region. We show results of a single experiment (three PCR amplifications) representative of three independent experiments. Student’s t-test was used to evaluate the strength of the difference between starred groups. Error bars represent one s.d. Foxc1 is enriched on the Msx2 enhancer. (B) Effect of a 24-hour BMP2 treatment on Foxc1 and Msx2 mRNA level was evaluated by qPCR in both 10T1/2 and O9-1 cells. (C) The 52 bp Msx2 Bmp-responsive element (Bmpre) (Brugger et al., 2004). Smad1 binding sites (blue) flank an AT-rich sequence (green). A partial Fox consensus binding site, AGCAATT [matching the consensus (G/A)(T/C)(C/A)AA(T/C)A in 5/7 positions (underlined)], overlapping the AT-rich sequence is boxed in red. (D) 10T1/2 cells were transfected with plasmids containing wild type (52bpMsx2-hsplacZ) or a mutant (52bpMsx2-mut-hsplacZ) in which the Fox site was mutated, and treated with BSA or BMP2 for 30 minutes. They were analyzed by ChIP with an anti-Foxc1 antibody or rabbit IgG as a control. qPCR was used to amplify a 200 bp hsp68 fragment immediately downstream of the 52 bp Msx2 (red arrows). We show results from at least three independent transfections. The interaction of Foxc1 with the Bmpre was almost completely abrogated by the mutation in the Fox/AT-rich element. (E) O9-1 cranial neural crest cells were treated with an siRNA against Foxc1 or EGFP. Cells were then treated with BSA or BMP2 and subjected to ChIP with an anti-P-Smad1 antibody or rabbit IgG. qPCR was used to amplify a 350 bp fragment in the 560 bp Msx2 enhancer. Student’s t-test was used to evaluate the strength of the difference between asterisked groups. Error bars represent one s.d.

