Fig. 2.
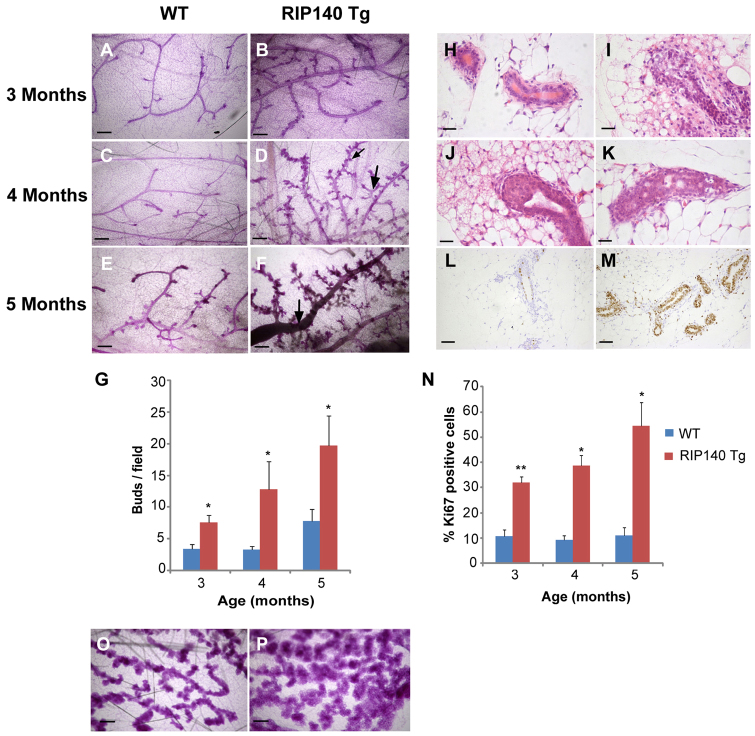
Analysis of mammary glands from RIP140 Tg mice. (A-F) Photomicrographs of mammary glands from WT (A,C,E) and RIP140 Tg mice (B,D,F) at 3 months (A,B), 4 months (C,D) and 5 months (E,F). (D) The large arrow shows more side branching and the small arrow highlights the alveolar buds observed in RIP140 Tg mice. (F) Arrow shows a distended primary duct. (G) Quantification of hyperbudding. (H-K) Normal ducts are present in mammary gland sections from 5-month-old WT (H) mice whereas age-matched RIP140 Tg mice show hyperplastic areas (I), terminal end buds (J) and multi-layered ducts (K). (L,M) Ki67 staining in mammary gland sections from WT (L) and RIP140 Tg (M) mice. (N) Quantification of Ki67 staining at 3, 4 and 5 months for WT and RIP140 Tg mice. (O,P) Photomicrographs of mammary glands from day 15 pregnant WT (O) and RIP140 Tg (P) mice. (n=3). *P<0.05, **P<0.005. Error bars represent s.e.m. Scale bars: 400 μm in A-F,O,P; 50 μm in H-K; 100 μm in L,M.

