
Fig. 3.
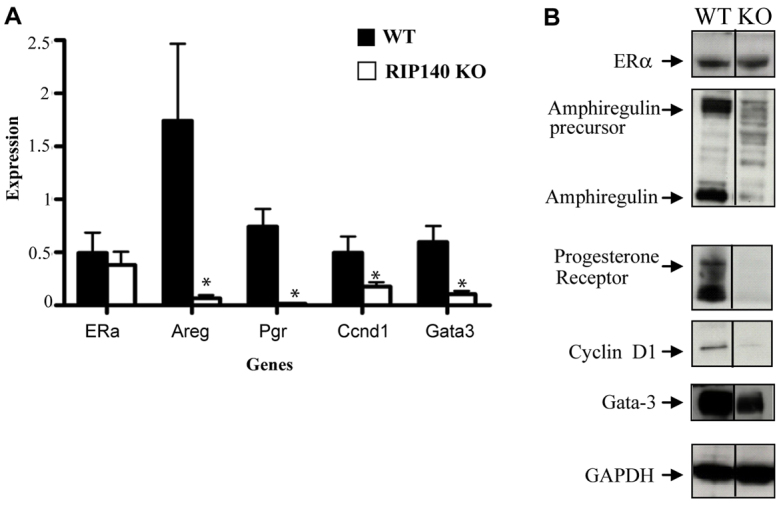
Expression analysis of the mammary glands. Q-PCR analysis (A) and protein expression (western blots) (B) of mammary glands from mature WT and RIP140 KO mice (n=4). Error bars represent s.e.m. *P<0.05.
Official websites use .gov
A
.gov website belongs to an official
government organization in the United States.
Secure .gov websites use HTTPS
A lock (
) or https:// means you've safely
connected to the .gov website. Share sensitive
information only on official, secure websites.
Expression analysis of the mammary glands. Q-PCR analysis (A) and protein expression (western blots) (B) of mammary glands from mature WT and RIP140 KO mice (n=4). Error bars represent s.e.m. *P<0.05.