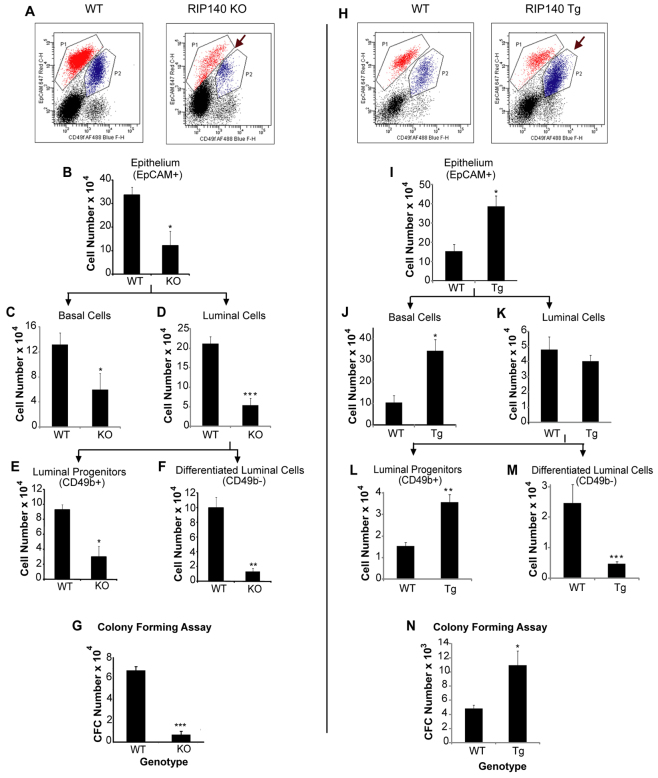
Fig. 6.
Analysis of the distribution of mammary gland cell populations in adult virgin WT (C57BL/6)/RIP140 KO and WT (FVB/N)/RIP140 Tg mice. (A,H) CD49f/EpCAM dot plots showing stromal (black), luminal (red, P1) and basal (blue, P2) cell populations in WT/RIP140 KO (A) and WT/RIP140 Tg (H) mice. (A) Arrow indicates reduced luminal and basal cell populations in RIP140 KO mice. (H) Arrow indicates enhanced basal cell population in the RIP140 Tg compared with WT. (B-F) Total number of epithelial cells (B), basal cells (C), luminal cells (D), luminal progenitors (E) and differentiated luminal cells (F) per gland in WT/RIP140 KO mice (n=3). (I-M) Total number of epithelial cells (I), basal cells (J), luminal cells (K), luminal progenitors (L) and differentiated luminal cells (M) per gland in WT/RIP140 Tg mice (n=4). *P<0.05, **P<0.005, ***P<0.0001. (G,N) Absolute number of colony-forming cells (CFCs) per mammary gland in WT/RIP140 KO (G) and WT/RIP140 Tg mice (N) (n=3). *P<0.05, ***P<0.0005. Error bars represent s.e.m.

