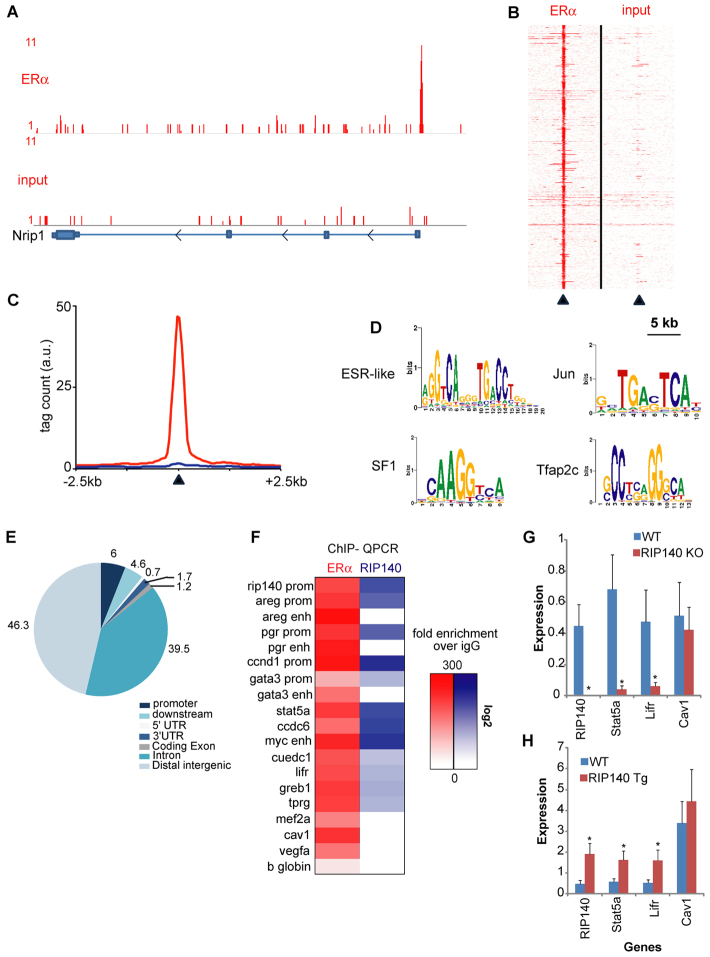
Fig. 7.
Chromatin interactions of ERα and RIP140 in the mouse mammary gland. (A) Genome browser snapshot of ERα binding events (top) over input control (bottom) at the RIP140 promoter region. Tag count and genomic coordinates are indicated. (B) Heatmap visualisation of raw read counts for ERα ChIP-seq (left) or input control (right) of all 881 identified binding events. A 5-kb window around the top of the peak (arrowhead) is shown. (C) Quantification of signal intensities of binding events as shown in B, depicting ERα (red) and input control (blue) at a 2.5-kb window around the top of the peak region (indicated by arrowhead). (D) Top-enriched motifs for ERα-chromatin binding events. (E) Genomic distributions of ERα binding event, related to the most proximal gene. (F) Heatmap visualization of ERα (red) and RIP140 (blue) binding events as confirmed by Q-PCR. Fold enrichment over IgG control is calculated and shown in a heatmap on log scale. (G,H) Q-PCR analysis of RIP140 expression and other ERα targets in WT/RIP140 KO (G) and WT/RIP140 Tg (H) mammary glands (n=4). *P<0.05. Error bars represent s.e.m.

