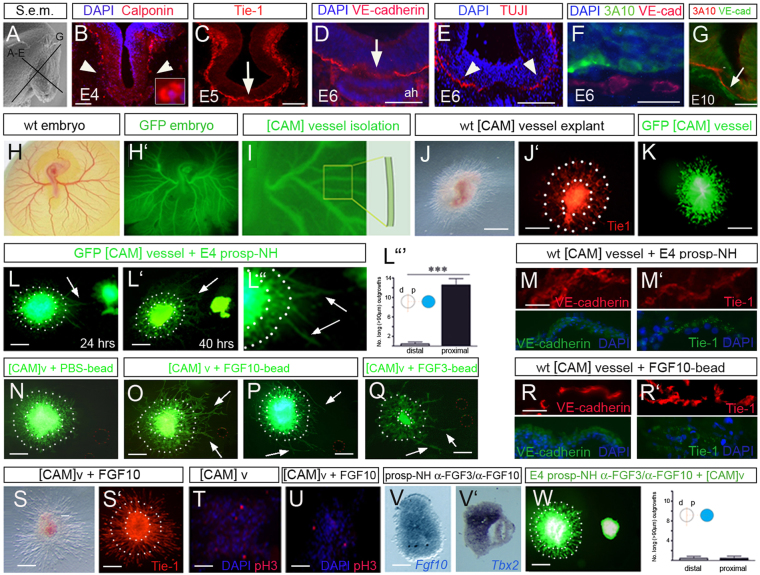
Fig. 4.
Prosp-NH-derived FGFs stimulate outgrowth of endothelial processes. (A-G) Transverse (B-F) and sagittal (G) sections through chick NH at planes indicated in A. D,E show serial adjacent sections. Arrowheads and arrows point to endothelial processes/axons outside (arrowheads) or within/beneath (arrow) ventral NH. (H-I) [CAMv] isolation from wild-type or Roslin-GFP embryos. (J-K) Short radial projections emerge from [CAMv] explants cultured alone for 48 hours. Whole-mount immunolabelling shows that these are Tie1+ (J′). Dotted circles in J′ outline explant and ring of short processes. (L-L″) [CAMv]-E4 prosp-NH co-culture after 24 (L) and 40 hours (L′). Arrows indicate long endothelial processes. (L′″) Quantitative analysis of long processes from proximal versus distal faces of [CAMv] explants. Error bars represent s.e.m. ***P<0.001. d, distal; p, proximal. (M,M′) High-power views, after sectioning; extending processes are DAPI+VE-cadherin+Tie1+. (N-R′) GFP [CAMv] explants cultured with PBS- (N), Fgf10- (O,P) or Fgf3- (Q) soaked beads for 42 hours. FGF-beads promote significant numbers of long projections from proximal faces of [CAMv] explants. Analyses of wild-type co-cultures reveals that endothelial projections are DAPI+VE-cadherin+Tie1+ (R,R′). (S,S′) Wild-type [CAMv] explant cultured with Fgf10 for 40 hours. Whole-mount immunohistochemical analyses show many long (>90 μm) Tie1+ projections. Dotted circles show explant outline and reference for control process lengths (see J′). (T,U) Transverse sections through [CAMv] explants cultured with/without Fgf10. No significance difference is detected in DAPI+ or pH3+ cells. (V,V′) Transverse sections through prosp-NH explants pre-soaked in anti-Fgf3 and anti-Fgf10 antibodies. Fgf10 and Tbx2 are expressed normally (compare with Fig. 2D). (W) Prosp-NH explant pre-soaked in anti-Fgf3 and anti-Fgf10 fails to provoke long process outgrowth from GFP [CAMv] explants, which appear similar to controls (compare with K). Righthand panel shows quantitative analysis. Scale bars: 70 μm in A-E,G-L″,N-Q,S,S′,V,W; 45 μm in T,U; 25 μm in M,M′,R,R′; 20 μm in F.

