
Figure 3.
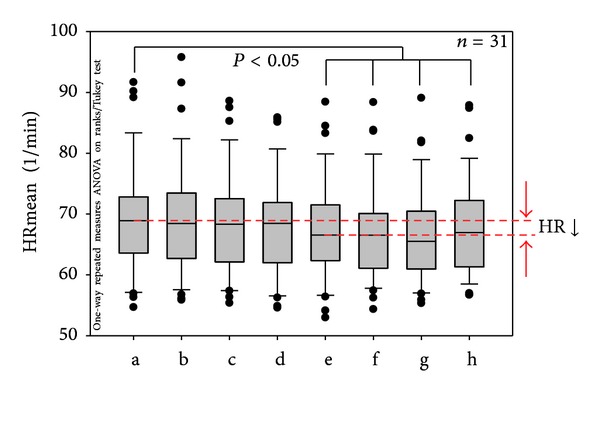
Box plots displaying the mean heart rate (HR) of the 31 patients. Note the significant decrease beginning in phase (e). The ends of the boxes define the 25th and 75th percentiles with a line at the median and error bars defining the 10th and 90th percentiles. The different measurement phases (a–h; cf. Figure 2) are indicated.