Figure 4.

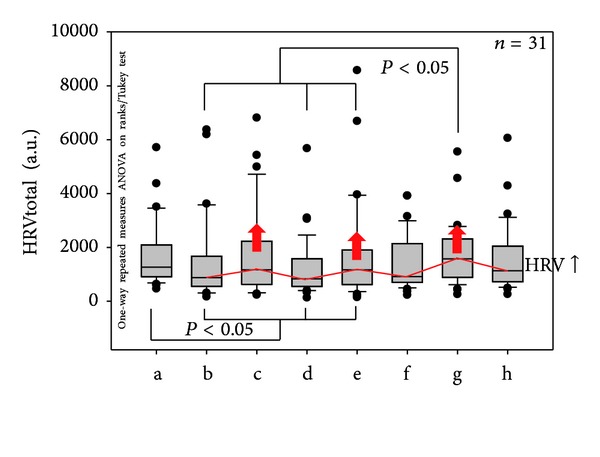
Statistical analysis and box plot illustration of HRVtotal of the 31 patients with insomnia. Note the stimulation-dependent increases in HRVtotal (red arrows). For further explanations, see Figure 3.

Statistical analysis and box plot illustration of HRVtotal of the 31 patients with insomnia. Note the stimulation-dependent increases in HRVtotal (red arrows). For further explanations, see Figure 3.