
Figure 6.
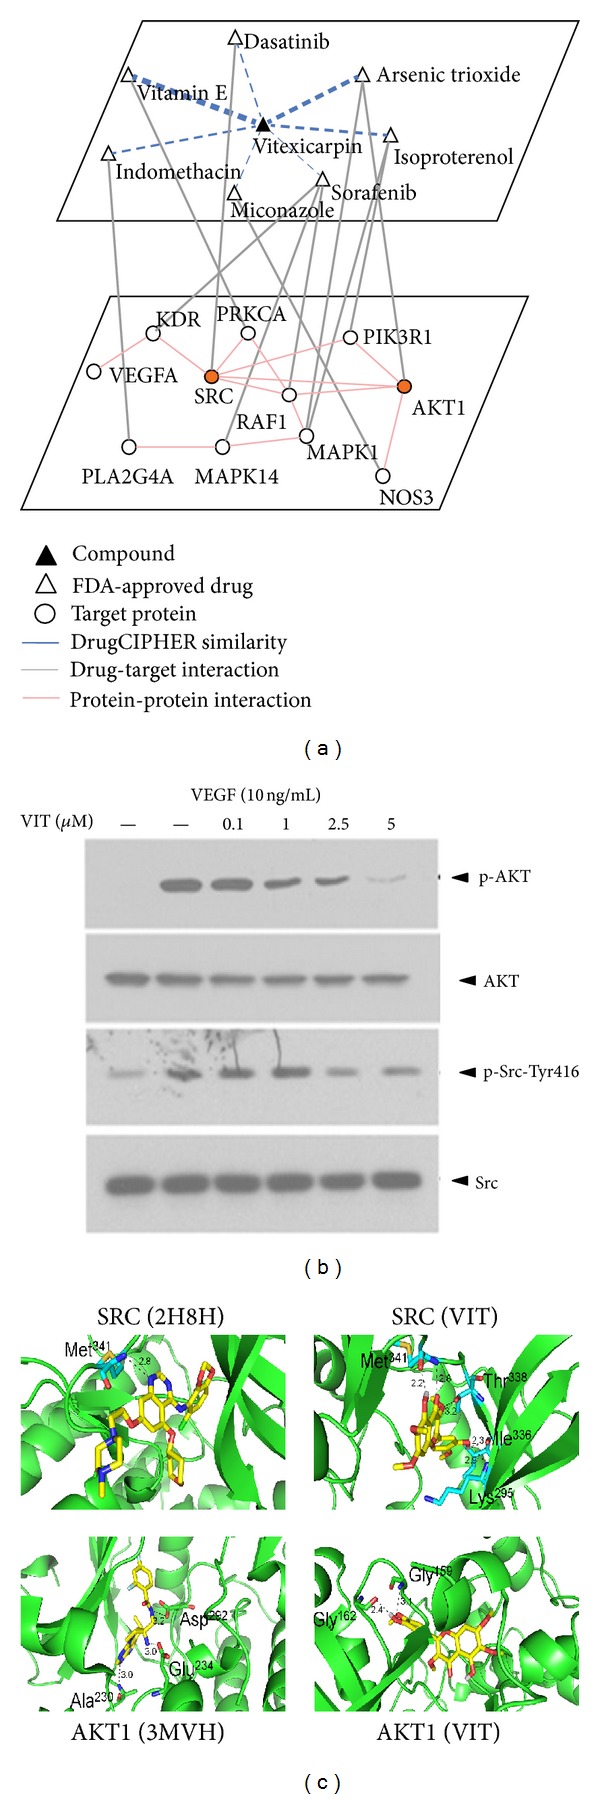
The constructed target angiogenesis-related network of vitexicarpin and experimental validation of two key molecules. (a) Network diagram showing vitexicarpin targeting network when inhibiting angiogenesis. The dot line thickness denoted by drugCIPHER similarities is the drugCIPHER scores' correlation coefficients between drugs and vitexicarpin. (b) Western blot analysis was performed to examine the changes of phosphoprotein levels of p-SRC and p-AKT in the vitexicarpin-treated HUVECs. Proteins were extracted from the cultured HUVEC at 30 min after vitexicarpin treatment and probed with proper dilutions of specific antibodies. Vitexicarpin inhibits VEGF-induced p-SRC and p-AKT phosphorylation in a dose-dependent manner. (c) Comparison of binding interactions of quinazoline inhibitor (PDB 2H8H) and vitexicarpin with SRC kinase (upper panel) and comparison of binding interactions of WFE (PDB 3MVH) and vitexicarpin with AKT1 (lower panel). Vitexicarpin is in stick. Carbon atom for vitexicarpin (yellow). Hydrogen bonds are displayed (dark dashed lines). The value on the dashed lines denotes the distance (Å) of H-bonds.