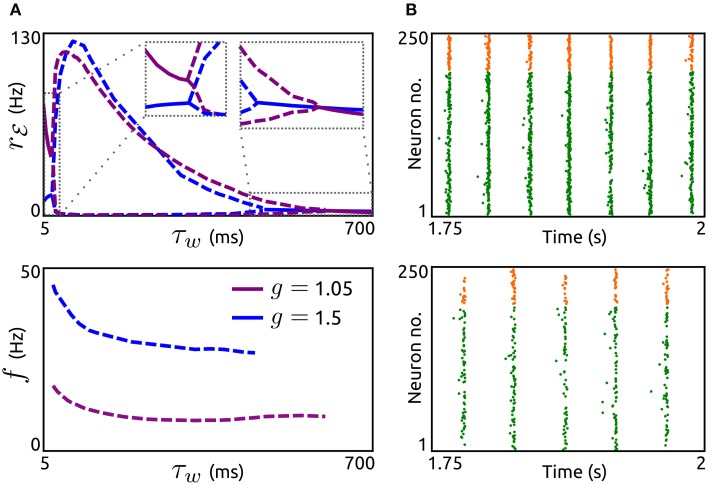
Figure 5.
Effects of adaptation timescale on network-based oscillations. (A) Top: Spike rate rℰ as a function of the adaptation time constant τw for networks with dominant recurrent excitation (g = 1.05, violet) and inhibition (g = 1.5, blue). Dashed lines indicate maxima and minima of oscillating rℰ, solid lines represent constant rℰ. Bottom: Corresponding oscillation frequencies f. a = 5 nS and b = 0.05 nA. rℰext = 7.5 Hz, τℰr = 1.25 ms, τℰd = 1.55 ms, τℐr = 0.98 ms, and τℐd = 2 ms. Other parameters as in Figure 4. (B): Raster plots of simulated networks of size N = 50,000 with g = 1.5 and τw = 100 ms (top) as well as τw = 400 ms (bottom), showing the spike times of 200 excitatory and 50 inhibitory aEIF neurons. Other parameter values as in (A).

