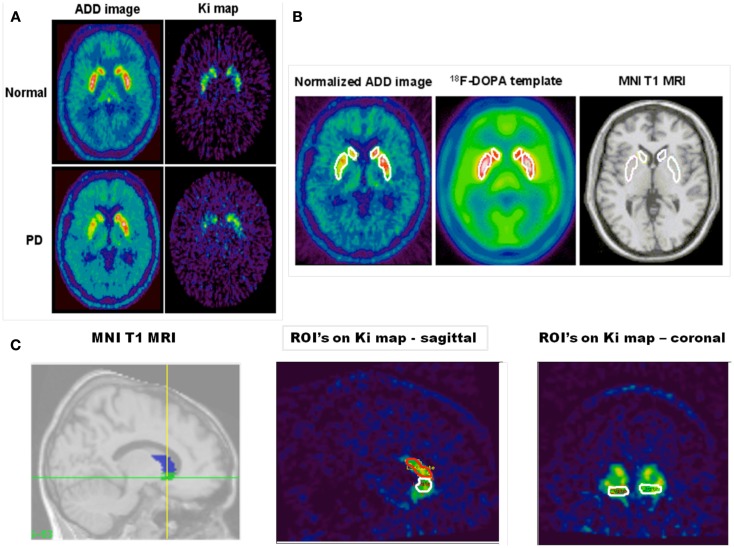
Figure 1.
The figure shows in (A) an FDOPA ADD (summed) and net influx rate constant (KI) image of a single slice from a healthy individual (top panels) and a patient with PD (bottom panels). In these images normalization to (MNI) space has been performed. Asymmetric decreased putamen and caudate uptake can be seen in the patient with PD. In (B) the figure shows; a template region object map overlying: the putamen and caudate nucleus bilaterally in a normalized FDOPA ADD image from a PD patient; the FDOPA template (created from five healthy controls) and the canonical single-subject T1 MRI found in SPM 99. (C) Shows the template object map, with volumes shaded, for the ventral striatum and caudate nucleus overlain on the canonical single-subject T1 MRI in sagittal section and next to it a spatially normalized KI image in sagittal section with the ventral striatum and caudate nucleus object map overlain. Also shown is a spatially normalized coronal section KI map through the ventral striatum with the object map overlain.

