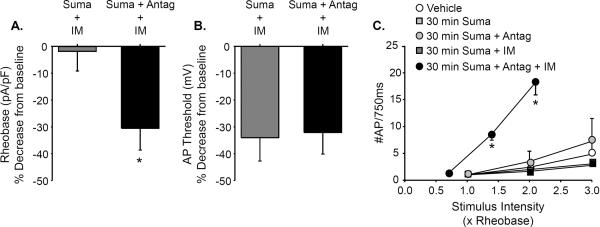
Figure 3. Prolonged sumatriptan exposure has no influence on excitability and attenuates IM-induced sensitization of dural afferents.

A. Following 30 minute pre-incubation with sumatriptan, IM application (Suma + IM) had little influence on rheobase (expressed as a % of baseline determined prior to the application of IM for each neuron). However, the IM-induced decrease in rheobase in neurons pre-incubated with the combination of sumatriptan and BRL 15572 (Suma + antag + IM) was significantly (Student's t test) greater than the change in observed in neurons treated with sumatriptan alone. B. In contrast to rheobase, application of IM resulted in a decrease in AP threshold in neurons preincubated with sumatriptan alone as well as the combination of sumatriptan and BRL 15572. There was no significant difference between these groups. C. Sumatriptan pre-incubation (Suma) had no significant influence on the baseline response to suprathreshold stimulation. Nor was there an influence of pre-incubating neurons with the combination of sumatriptan and BRL 15572 (Suma + Antag). Data were analyzed with a two-way repeated measures ANOVA and compared to control neurons incubated in vehicle for 30 minutes (Vehicle). Furthermore, the application of IM to neurons pre-incubated for 30 minutes with sumatriptan (Suma + IM) had no significant influence on the stimulus response function as determined with a one-way repeated measures ANOVA. However, application of IM to neurons pre-incubated with the combination of sumatriptan and BRL 15572 (Suma + Antag +IM) resulted in a significant leftward shift in the stimulus response function as determined by both the increase in the number of evoked action potentials at 2× and 3× rheobase (relative to the response prior to the application of IM), as well as the proportion of neurons in which IM produced a change (4 of 4) relative to the Suma + IM group (0 of 7, p < 0.01, Fisher Exact test). * Indicates a significant difference between groups in A and before and after IM application in C where p<0.05.
