
Figure 4.
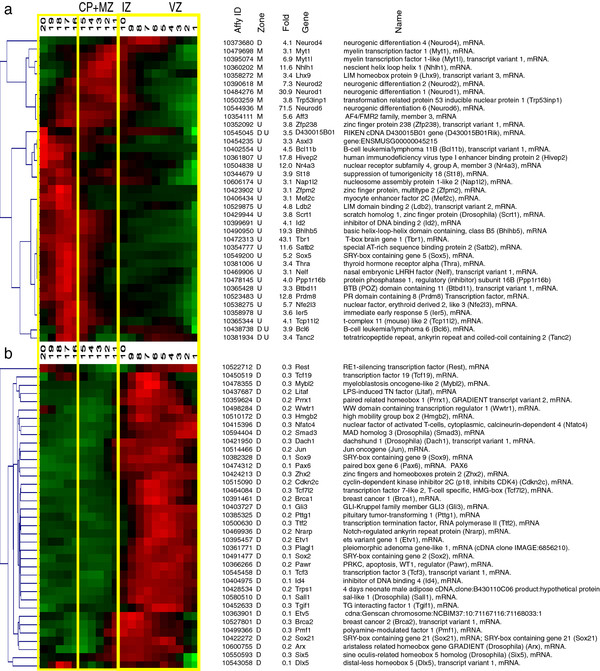
Transcripts encoding transcription factors. Functional groupings of QISPs based upon Gene Ontology (GO) molecular function and biological process annotations. a, Clustered QISPs of transcripts expressed ≥ 3 fold higher in Eomes + neurons compared to GFP- cells. The left-most dendrogram reveals the hierarchical arrangement of QISPs. b, Clustered QISPs of transcripts expressed ≥ 3 fold lower in Eomes + neurons compared to GFP- cells. a’ and b’.