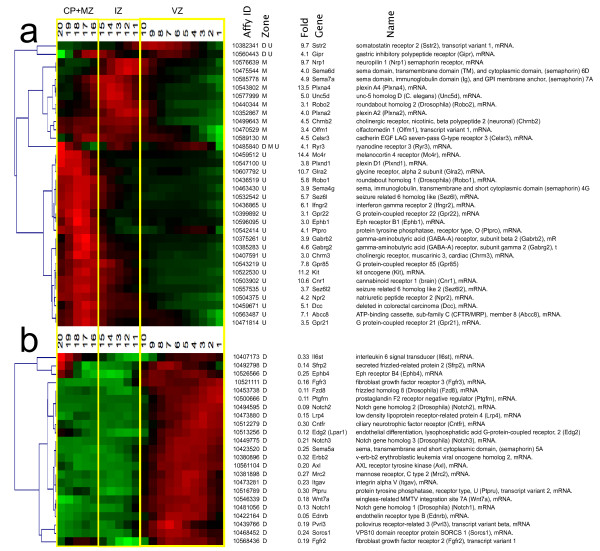
Figure 6.
Transcripts encoding receptors. Functional groupings of QISPs based on Gene Ontology molecular function and biological process annotations. Graphical representation as in Figure 4. Clustered QISPs of transcripts expressed (a) ≥ 3 fold higher and (b) ≥ 3 fold lower in Eomes:: GFP + cells compared to eGFP- cells.

