
Figure 3.
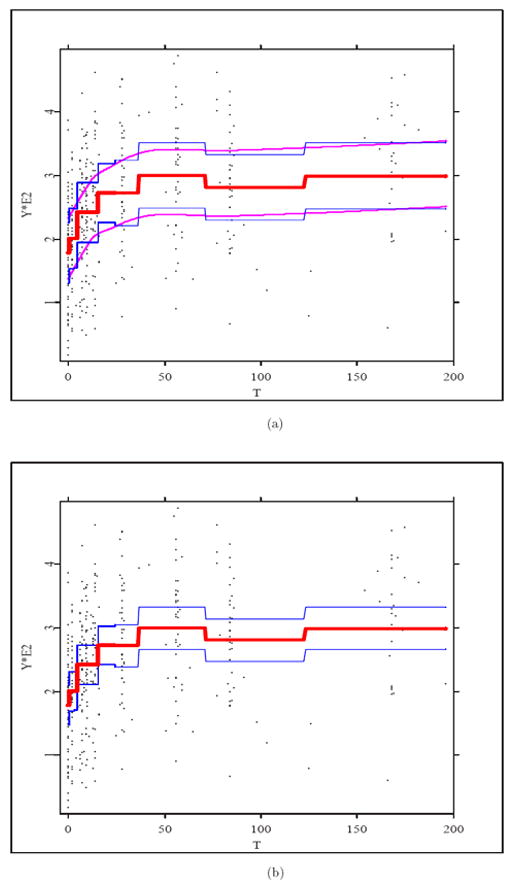
Plots of the piecewise-constant spline estimator (thick line), the data (dots), and (a) confidence band (4.2) (upper and lower solid lines), the smoothed band (upper and lower thin lines), (b) pointwise confidence intervals (upper and lower thin lines) at confidence level 0.95.