
Figure 1.
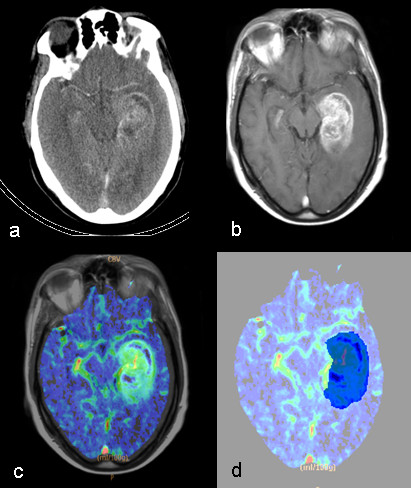
Volume of Interest delineation. Axial CT slice illustrating a section of the tumor (a); transverse contrast-enhanced T1-weighted image co-registered to the CT slice (b); co-registered transverse contrast-enhanced T1-weighted image overlaid on the CBV map (c); the user-defined region of abnormal perfusion on the CBV map (in blu) (d).