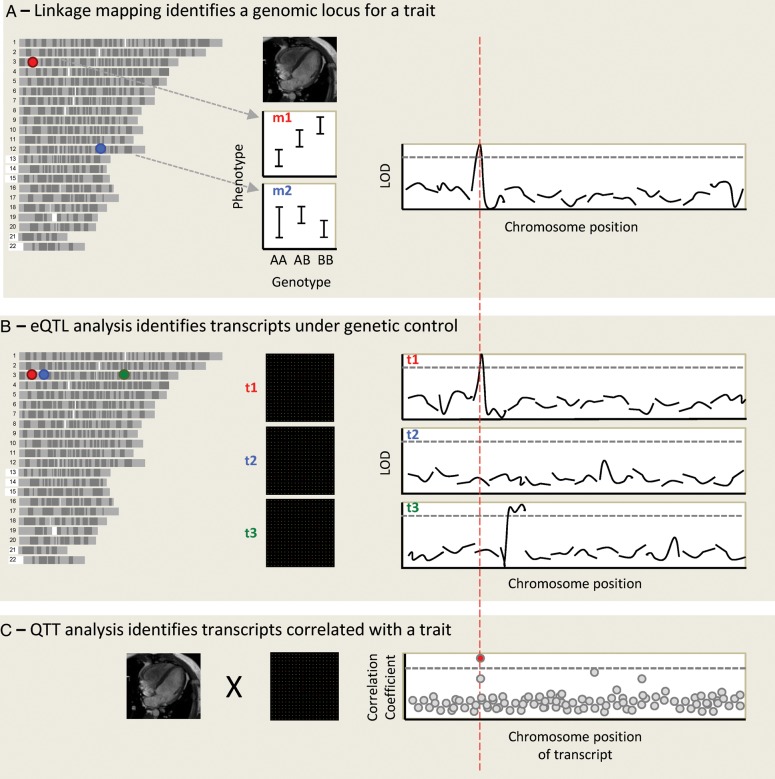
Figure 2.
An integrative genomic approach to identify cardiovascular disease genes. Genotypes and phenotypes are measured in a population of related individuals, and each genomic marker position is assessed for linkage with the phenotypes. In this case, left ventricular mass (LVM) is studied in a rodent population. The allelic effect is shown for two genomic markers, marker 1 (m1) on chromosome 3 (chr3) and m2 on chr12. A linkage plot is shown for the first 12 chromosomes, showing linkage of LVM to a locus on chr3, at the position of marker m1. The y-axis is the LOD score (logarithm10 of odds), and the dotted line represents genome-wide statistical significance. (A) Microarrays are used to obtain a genome-wide transcript expression profile for RNA expression in the left ventricle in the same population, and the expression of each transcript is mapped as a quantitative trait. The expression of transcript 1 (t1) maps to chr3, where this transcript is encoded: it is hence termed a cis-eQTL. t2, encoded at the same genomic locus, does not appear to be genetically regulated. Although both genes lie within the original LVM locus, t1 is prioritized as the best candidate after eQTL analysis. Expression of t3, also encoded on chr3, maps to chr4: it is a trans-eQTL. (B) Quantitative trait transcript analysis involves the direct correlation of phenotype and expression data. After correction for multiple testing a single transcript emerges as most highly correlated with LVM. If this is t1 this adds further weight to its candidacy.

