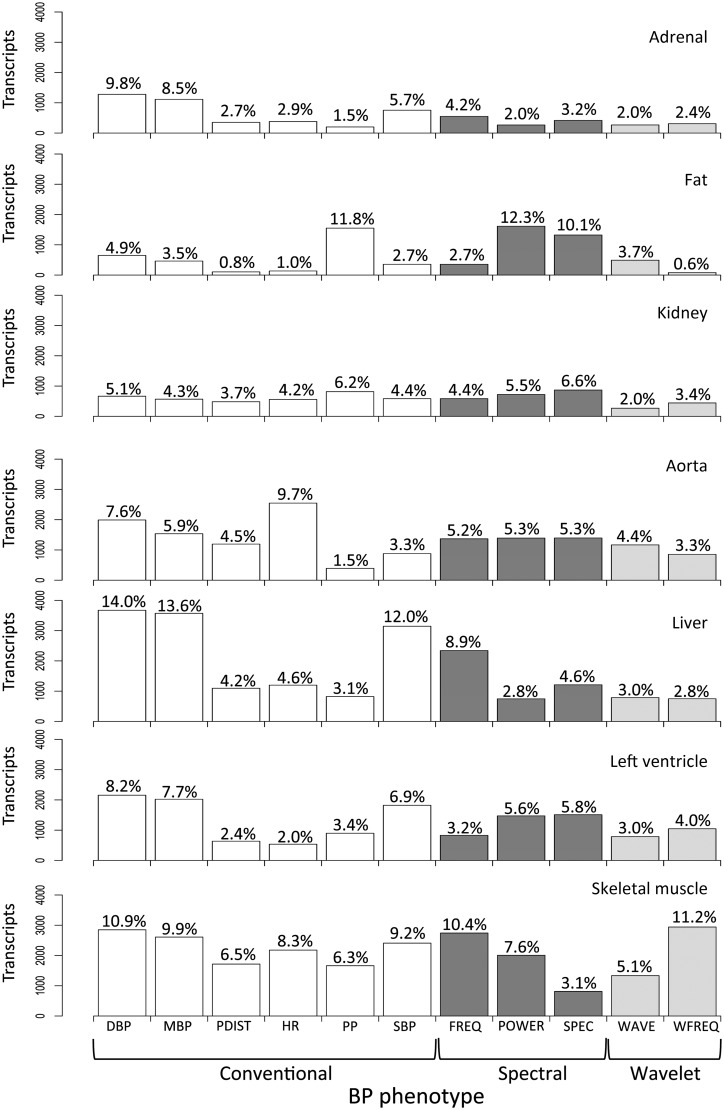
Figure 4.
Rat genes associated with blood pressure phenotypes. For each tissue the number (and %) of transcripts that were significantly associated with each BP phenotype by QTT analysis is reported (FDR <5%). Eleven BP phenotypes were grouped as ‘conventional’ (diastolic blood pressure, DBP; mean blood pressure, MBP, peak-to-peak distance, PDIST; heart rate, HR; pulse pressure, PP; and systolic blood pressure, SBP), ‘spectral’ (maximum frequency, FREQ; total power, POWER, and maximum spectra, SPEC), and ‘wavelet’ (wave amplitude, WAVE and wave frequency, WFREQ).

