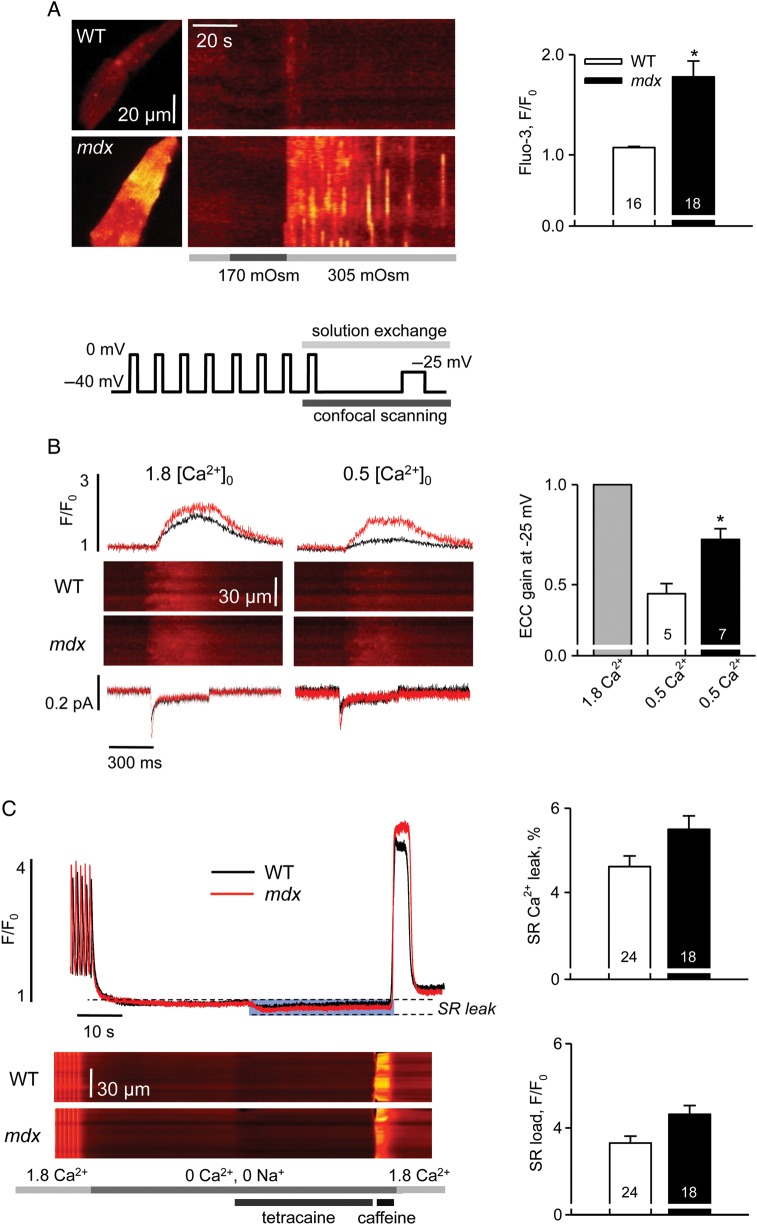
Figure 1.
Intracellular calcium homeostasis in cardiomyocytes from 1-month-old mice. (A) Intracellular Ca2+ responses to mild hypo-osmotic shock in WT and mdx cells. Left panels are XY images of cardiac myocytes after returning to isotonic solution and line-scan representations of series of images acquired from the cells on the left upon application of an osmotic challenge. Averaged fluorescence was determined within each cell and converted to a two-dimensional X,t image (as in Martins et al.32). Bars under the line-scans depict the protocol of extracellular solution changes. Right panel represents pooled data of mean values of normalized fluorescence during 60 s after the osmotic shock. The averaged response to the osmotic shock was extremely small in WT cells compared with mdx. (B) Left panels show representative traces of Ca2+ currents, line-scan images of Ca2+-related fluorescence and normalized cytosolic transients elicited by a 400 ms test pulse to −25 mV in WT and mdx cells superfused with either 1.8 or 0.5 mM Ca2+. Line plot on the top represents the voltage protocol used for the experiments. Right panel shows the statistical comparison of EC-coupling gain in 0.5 mM Ca2+ in WT and mdx cells. For each group, data were normalized to the value of the gain obtained in 1.8 mM Ca2+. SR Ca2+ release was much more resistant to the reduction in ICa trigger in mdx myocytes. (C) Left panels illustrate intracellular Ca2+ signals during the protocol designed to estimate SR Ca2+ leak (as in Shannon et al.14): line-scan images of fluo-3 fluorescence and normalized cytosolic transients. Bars on the bottom depict the protocol of extracellular solution changes. Averaged values of estimated SR Ca2+ leak and SR Ca2+ load in WT and mdx cells are shown at the right. The SR Ca2+ leak was determined as a reduction in the resting fluo-3 fluorescence following tetracaine application, expressed as a per cent of SR Ca2+ content estimated from the amplitude of the caffeine-induced SR Ca2+ transient. There was no significant difference in the values obtained in WT and mdx cells. See Supplementary material online, Table S1 for details.

