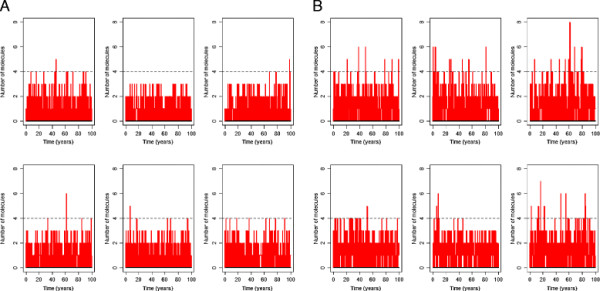
Figure 2.

Simulation output for model of Aβ turnover. The graph shows the level of Aβ versus time over a 100 year period in 6 typical runs. A kdegAbeta = 2.1 e-5 s-1 B kdegAbeta = 1.5 e-5 s-1. The horizontal dashed lines correspond to the assumed threshold required for dimerisation to occur.
