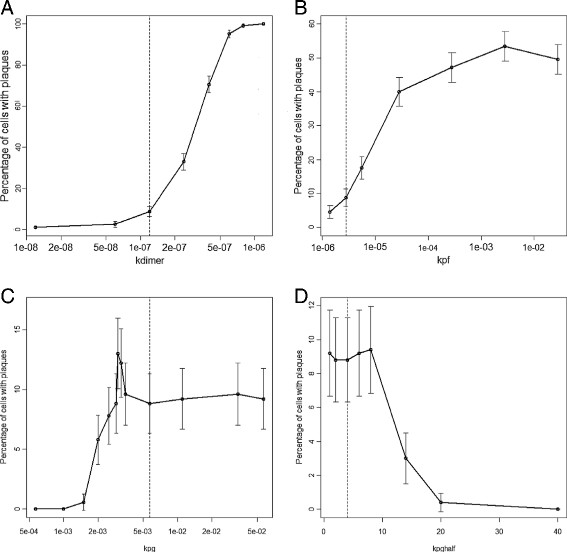
Figure 6.

Effect of varying parameter values on plaque formation. Akdimer, Bkpf, Ckpg, Dkpghalf. Each point shows the percentage number of cells associated with plaques at age 100 years from 500 simulations. The error bars show 95% confidence intervals for the percentages. The dashed vertical line indicates the default parameter value. In B the x-axis is plotted on a log scale as the parameter values were varied over four orders of magnitude. In A and C the x-axis is plotted on a log scale as the parameter values were not linearly spaced.
