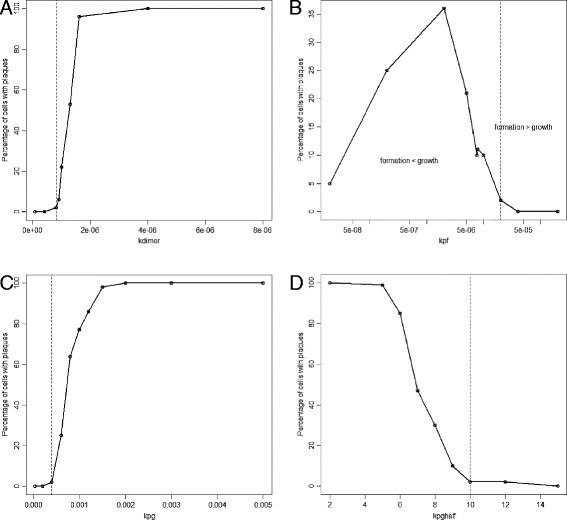
Figure 9.

Simulation results showing sensitivity of parameters for Model 3. Akdimer, Bkpf, Ckpg, Dkpghalf. Each point shows the percentage number of cells associated with plaques at age 100 years from 100 simulations. Dashed black lines indicate the default value of the parameter. Red dashed line in B indicates where the rate of plaque formation is approximately equal to the rate of plaque growth.
