
Figure 1.
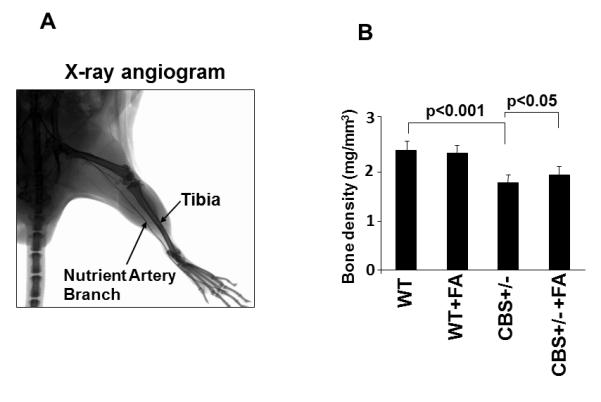
A: Representative, a typical barium-contrast x-ray angiogram of tibia bone of mice. The arrows indicate tibia bone and the nutrient artery to the tibia bone. B: Effect of folic acid on tibia bone density. The bone density was measured using KODAK MM-4000 whole body x-ray image scanner and bone density software. n=5 in each group. *P < 0.05 compared with WT; #P < 0.05 compared with CBS+/−. n = 5 for all groups.