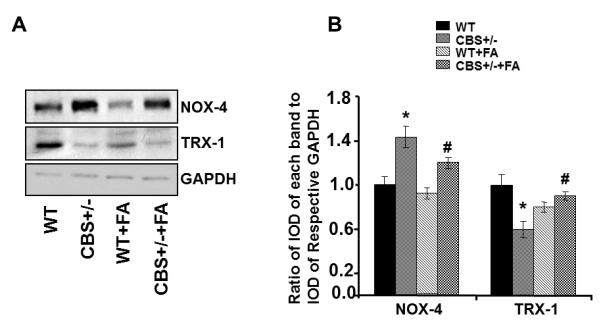
Figure 3.

Effect of Folic acid on oxidative stress: A: Western blot analysis for NOX-4 and Trx-1protein levels in tibia tissue of WT, CBS+/−, WT+ FA, and CBS (+/−) +FA. GAPDH was used as control (gel panels). B: Relative protein expression is reported as a ratio of IOD of each band to the IOD of the respective GAPD H band. *P < 0.05 vs. WT. #P<0.05 vs. CBS+/−. n = 5 for all groups.
