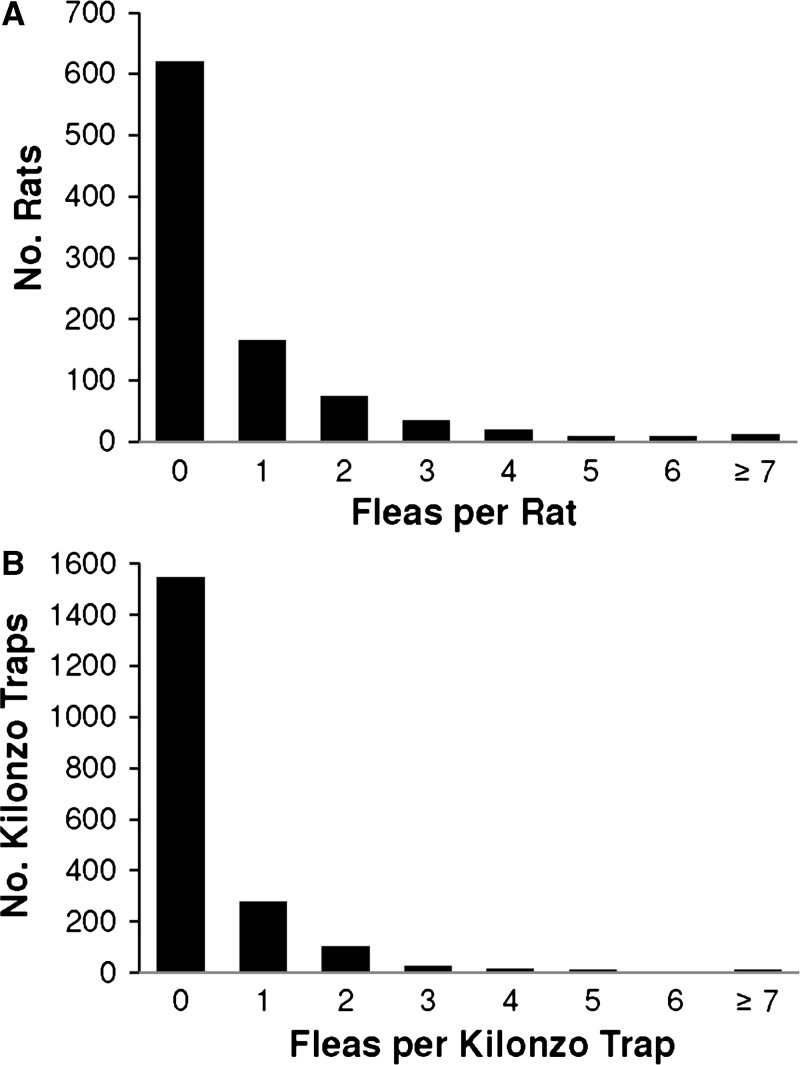
Figure 2.
Distribution of fleas collected inside huts in Vurra and Okoro counties per (A) Rattus rattus and (B) modified Kilonzo light trap. The χ2 goodness-of-fit analysis revealed that neither the distribution of fleas per rat (N = 944, λ = 0.77) nor the distribution of fleas per hut (N = 2000, λ = 0.42) was consistent with a Poisson distribution (P < 0.001).

