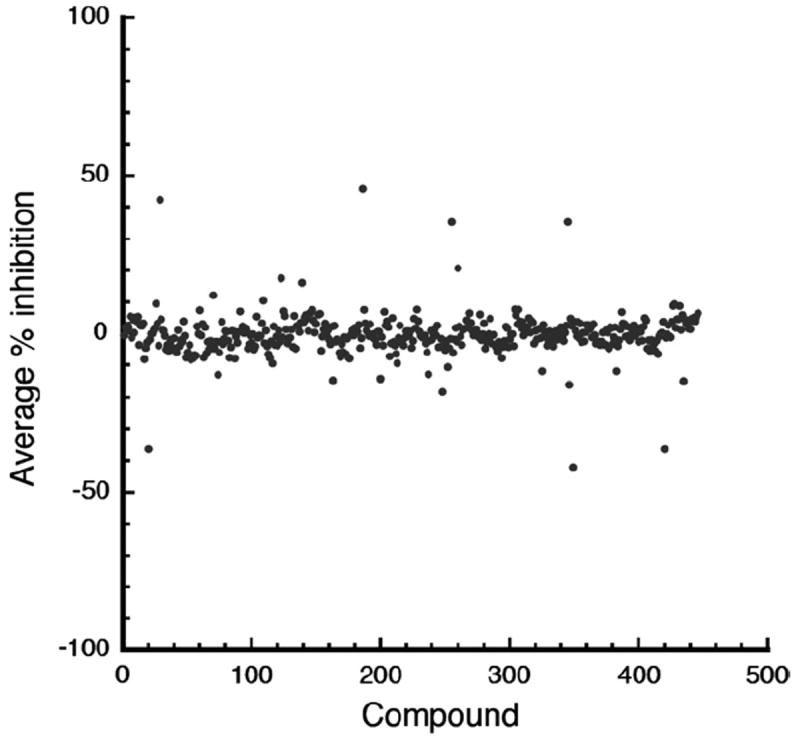
Fig.6.

Pilot screen results using the NIH Clinical Collection Library. Scatter plots show the averaged percentage inhibition for each compound. One compound that exhibited increased overall fluorescence consistent with assay interference and yielded an overall −145% level of apparent “inhibition” is not shown for clarity. The overall S/B ratio was 4.9 and the Z’ factor was 0.68 for the pilot screen.
